City Blues By The Numbers

You are here: Home / 2018 / Archives for July 2018

Archives for July 2018

NYCFC Weekly Updates By The Numbers – MLS Week 21 July 23, 2018

July 23, 2018 by Mark Leave a Comment


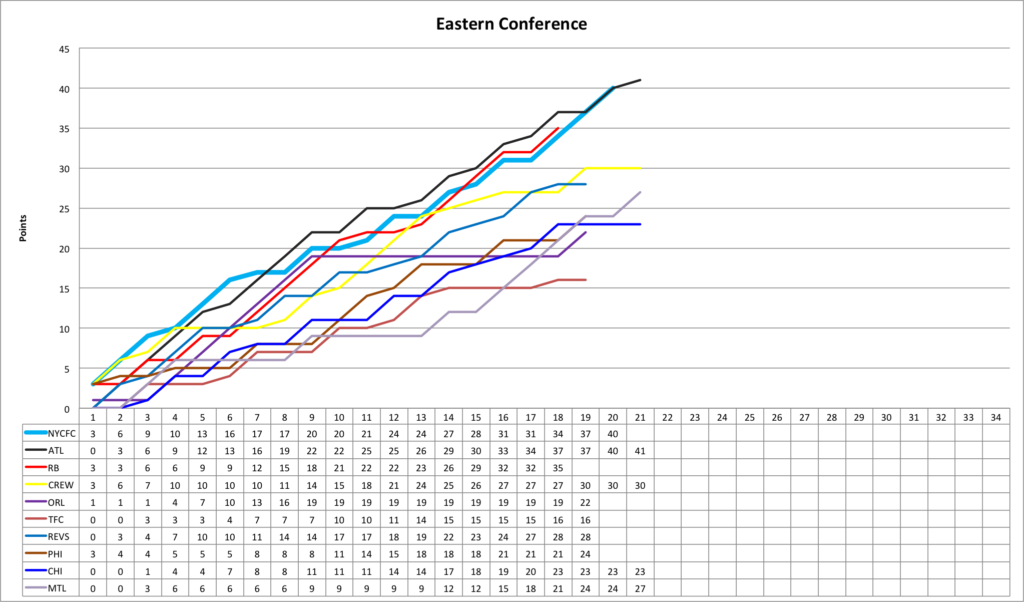
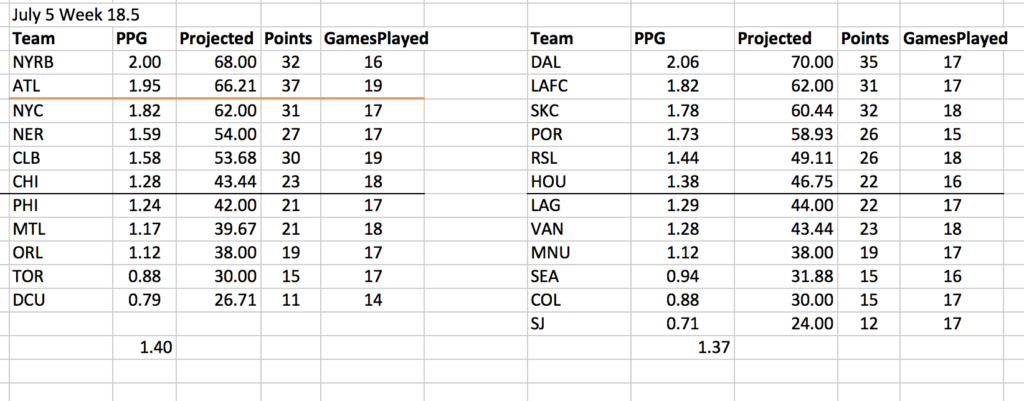
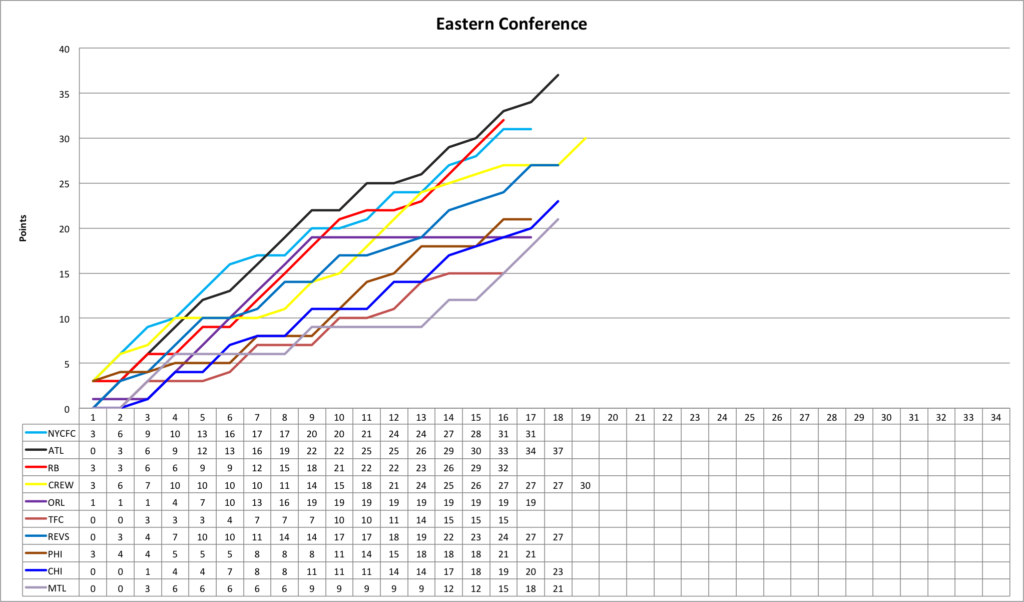
NYCFC did not play this week but just about all the other teams that NYCFC fans care about did. The top 3 other teams in the East won, though Columbus hardly causes any worry any more. In the West, Dallas earned a tough road point in Houston, Portland dropped 2 points at home and LAFC dropped 3 in spectacular fashion in Minnesota.
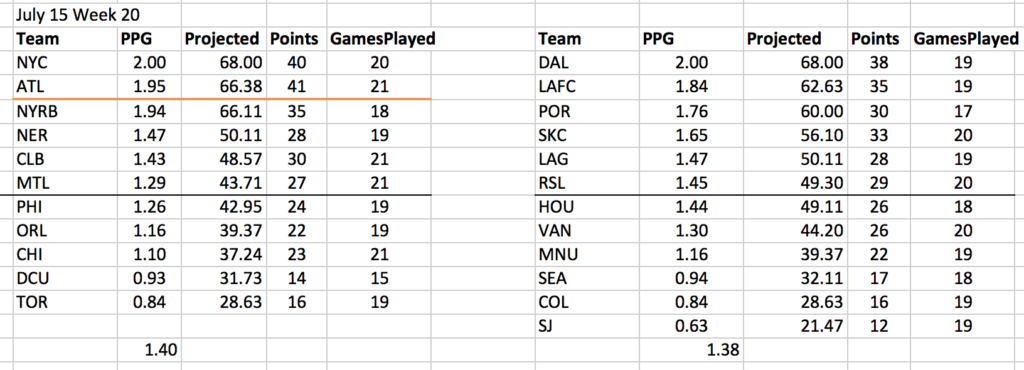
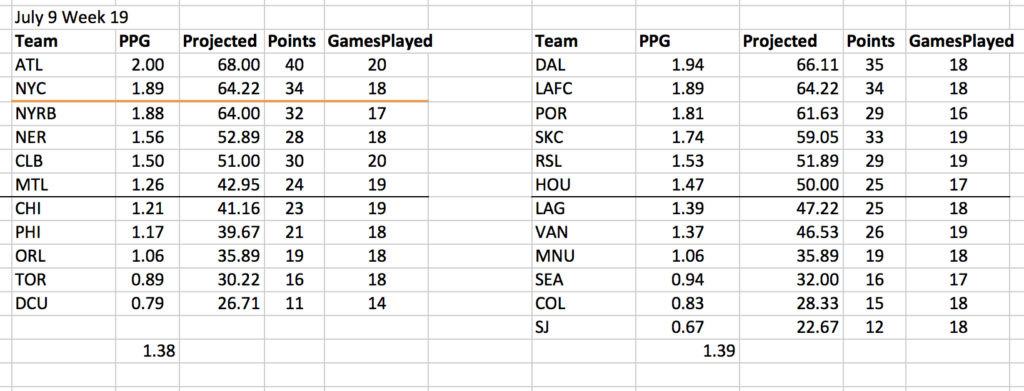
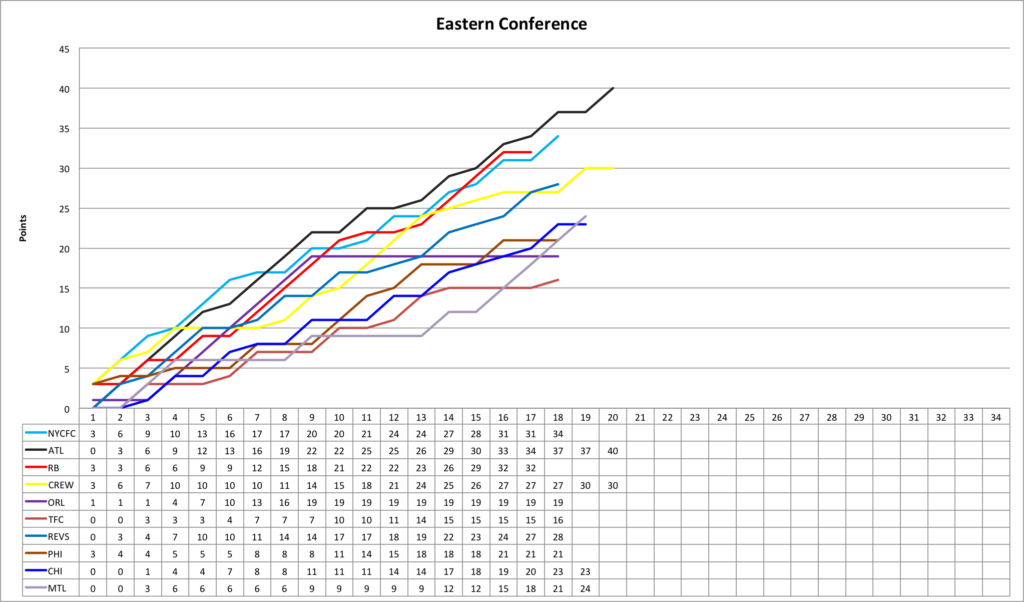
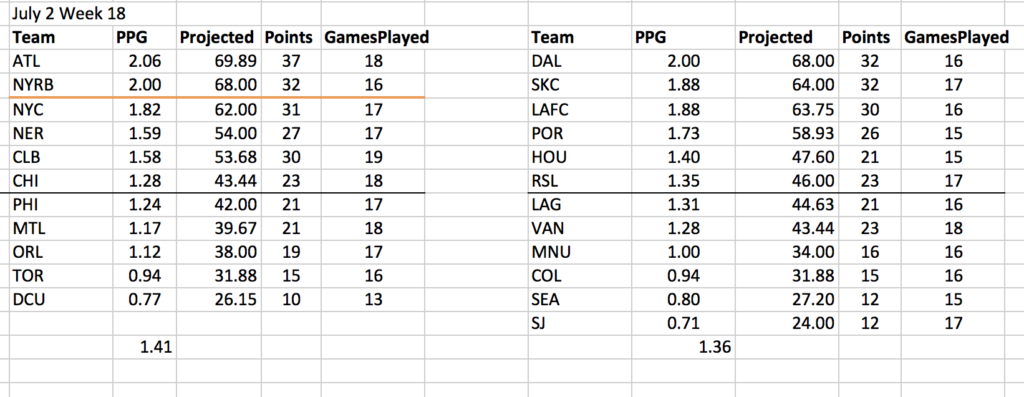
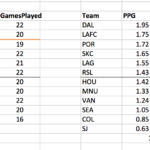
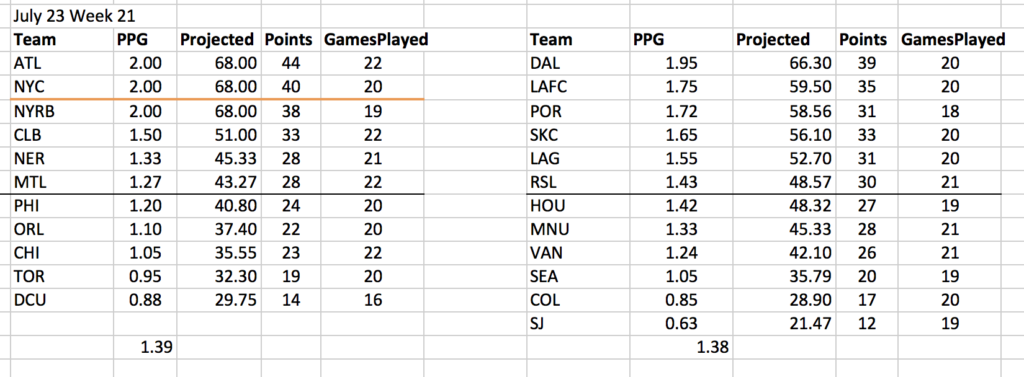
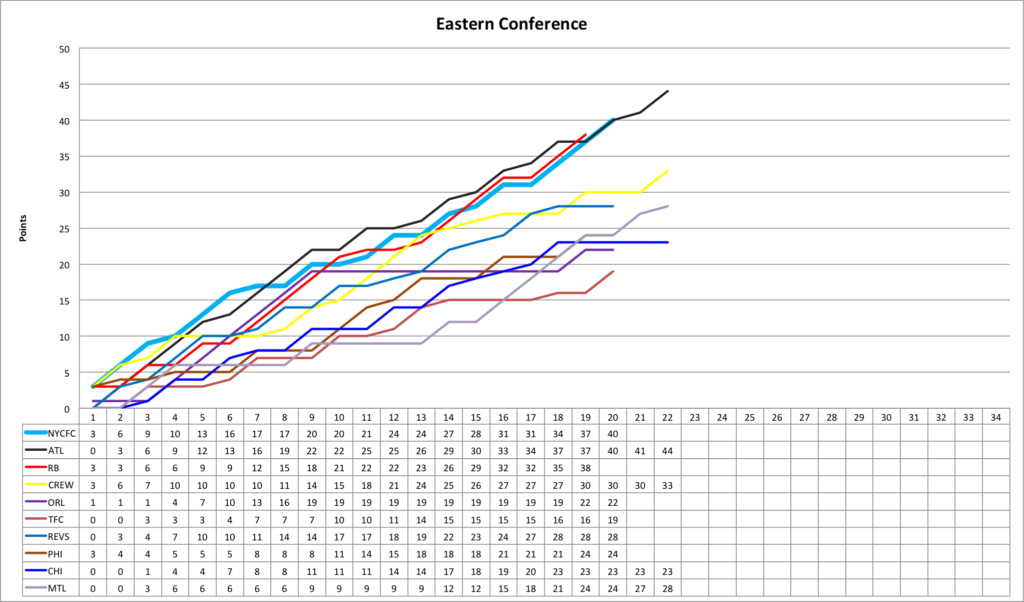
The net result is the East has a 3-way tie on PPG, though NYC can leapfrog Atlanta if it wins its 2 extra games, and RB can leapfrog both if they win all their extra games. All three East leaders have a better PPG than anybody in the West, but after that the West exceeds the East. Compare the East playoff line of 43-44 to the 48-49 projected in the West. This is a major reversal from this time last year, when the 5th place East team had a better PPG than the 2nd place West team. In fact, this time last year, the East won every same place matchup from 1st through 9th. Right now, the West wins 4th through 9th. The 3 best teams are in the East, but it gets real thin after that. There are probably 2 playoff spots in play after Columbus in the East.

That makes it hard to start dropping teams from contention in the East. If anything, DC might force their way onto my chart if they can make a run based on all their home games, though Rooney’s going to have to stop giving the ball away. Philly can’t put the ball in the net. The Revs still can’t win on the road. Toronto are getting players back but have a lot of teams to climb over.
In the West, Minnesota just climbed to within one win from the playoff line with 4 wins in 5, including a a 3 win week like NYC just had. But they now get 6 of the next 7 away before enjoying 5 of the last 7 at home. The Galaxy have quietly solidified a playoff claim with no losses since May. Portland has not lost since April. Barring a collapse by one of those teams, RSL, Houston, Minnesota, arguably Vancouver and charitably Seattle are fighting over one spot.

Filed Under: 2018 Weekly Updates

NYCFC’s Fantastic Home Streak, Running 2 Years and Counting

July 17, 2018 by Mark Leave a Comment

It is easy to spot that NYCFC has the league’s best Home record right now at 10-0-1, earning 31 of a possible 33 points.  But even the most devoted NYCFC fan might not be aware of this cherry-picked bit of data: over the last 36 home games, going back to June 2016, NYC is 27-2-7, earning 88 out of a maximum 108 points, 2.44 PPG, and a +51 Goal Differential.  The last loss before this streak was to RSL at home on June 2, 2016.  The only 2 home losses since then were to Orlando last April and Portland in September.  The 36 games is a bit more than 2-years worth of home games.

Even crazier is how sudden and extreme was the change in NYCFC’s home performance.  Before this run started, in 2016 the team was 1-3-5 at home. The schedule was front-loaded with home games, and they dropped points like crazy. After the 2016 RSL game the team PPG was 1.31 overall, which projected to 45 points at season end.  Many people, including me, thought they would not make the playoffs. Then they finished 7-0-1 at home, and ended with 54 points and 1.59 PG.  NYCFC’s combined 2015 Home record plus 2016 through RSL was 7-10-9 for 1.15 PPG and a -7 GD.

What Led To The Switch

What happened?  Here are some thoughts. The 2015 team was, of course, not very good.  It is no surprise that its home record was poor. The 2016 team was a substantial improvement, but they had a difficult adjustment to the play-from-the-back style that new coach Patrick Vieira implemented and had a 3 bad habits giving up goals off set plays, and at the end of either half. Many of these incidents led to disappointing draws.

March 13 Toronto – TFC scores in extra time on a free kick at the end of the first half to cut NYC’s 2-0 lead in half, ends 2-2 draw
March 26 New England – The Revs tie the game on a free kick, score remains 1-1
April 27 Montreal – The Impact even the game at 90+1 on a free kick
May 29 Orlando – the Lions earn the draw at 90+4

This accounts for 4 of the 5 draws in the first 9 home games of 2016.  Whether this was just a run of bad luck that inevitably would change, or chronic lapses of concentration they were able to cure, it stopped.  The team also improved in running its new system, and the streak began. It is also worth noting that the pre-streak home goal differential of -7 includes the Red Bull Wedding game, meaning its Goal Differential apart from that game was even and the team probably underperformed at home to that point.

Why This Is Not More Widely Noted

The best parts of the streak are the 2 partial seasons: the 7-0-1 at the end of 2016 and 10-0-1 to date in 2018. During the only full season in the streak, NYCFC was merely solid at home, tied for just the ninth best home record in the league. Because the 2016 and 2017 overall home records were not particularly great, the team’s strong start at home in 2018 seems like more of an aberration than it really is.  You do have to limit the data to this somewhat contrived stretch to see how good the team has been at home for more than 2 years.  It is a justifiable contrivance, though, because of its length. I wouldn’t start looking up t best 36-game home stretches in MLS all time, but a record that long and strong is worth noting just for itself.

Filed Under: NYCFC Misc

NYCFC Weekly Updates By The Numbers – MLS Week 20 July 15, 2018

July 15, 2018 by Mark Leave a Comment

Well that was a hell of a week. 9 points in 7 days (though 3 of those points are reflected in the prior update).
Red Bulls and Dallas won their games. But Atlanta, LAFC and Portland all dropped 2 points, the first two at home. Dallas and NYC now top the league with 2.0 PPG. Atlanta continues the odd trick of performing slightly worse at Home than Away.

The gap between the top 3 in the East and the rest is growing. In the West, 4th place SKC is slipping and is now nearly halfway between 3rd place Portland and the Galaxy in 5th. It is very likely that a team in the East will get more than 60 points and not get a bye. There is a decent chance of that happening in the West.
Three wins in a row makes for pretty lines:

The current trend has the team finishing with a point total in the high 60s. It’s necessary to remember, however, that they have now played 2 more Home than Away games. That is the most imbalanced in favor of Away they have been or will be all season. It is also the most imbalance from now to the end. After getting even with the next 2 Away, the schedule never goes more than +/-1 the rest of the way. Still, remember that of the remaining 16 games, just 7 are Home and 9 Away when reviewing this:

Here is the East line graph:


Villa has started 10 of NYCFC’s 20 games to date. He did not play in 7 and came in as a sub in 3. The club record when he starts is 5-3-2, 1.70. When he does not start the record is 7-1-2, 2.30. Of the non-starts, the record is 5-1-1, 2.29 when he does not play at all.
His starts are evenly split 5 Home 5 Away. His non-starts are 6 Home 4 Away. This does give an advantage to the non-start record, but even if you add one win to the record when he starts and delete one win from games he does not start, to compensate for the schedule disparity, then the record without him is still better, by 2.22 PPG with to 1.82 PPG without.
I do not think this proves that the team is better without Villa. You need to adjust for opponent quality, who else was injured, and your own eye test. But, I am fairly certain this demonstrates the team can succeed very well without him, which is not something anyone is likely to have believed until very recently.

Filed Under: 2018 Weekly Updates

NYCFC Weekly Updates By The Numbers – MLS Week 19 July 9, 2018

July 9, 2018 by Mark Leave a Comment

This will be a low text level update for the week. The graphs will have to do except for a couple of quick points.

  • Dallas gave us a big boost beating Atlanta midweek, but I was disappointed by Atlanta’s result in Philadelphia. The Union played quite well, I thought, but did not finish some good chances. Atlanta has a very easy schedule remaining and Away at Philadelphia was actually one of their tougher remaining challenges as the Union has a big H/A disparity in performance.
  • If David Villa plays every minute from now to the end of the season it will be still less than last year and average 69 minutes per game overall.


Filed Under: 2018 Weekly Updates

NYCFC Weekly Updates By The Numbers – MLS Week 18.5 July 5, 2018

July 5, 2018 by Mark Leave a Comment

Mini-midweek update because last night messed with the top of the PPG standings:

Dallas now tops the league after beating Atlanta, and RB tops the East.

A commenter in the recap of the Dallas-Atlanta game on the MLS site asked if Atlanta has beaten any teams above the red line. They have, but it led me to ask how the really top teams have fared against each other. I drew the line at the top 7 PPG teams — all with a PPG of 1.70 or higher.

RB 4-0-0 3.00 Remaining 3H2A
POR 2-1-3 1.50 Remaining 1H2A
FCD 2-2-2 1.33 Remaining 1H2A
SKC 1-1-1 1.33 Remaining 3H3A
NYC 2-2-3 1.29 Remaining 2H0A
ATL 1-3-3 0.86 Remaining 0H1A
LAFC 0-3-2 0.40 Remaining 2H2A

The Red Bulls record is impressive, even given that 3 of the 4 have been at home. They are quite fortunate in that they play all the top West teams at home this year: Dallas, LAFC, Portland, and SKC. Atlanta has not done well but has just one such game left in Harrison. LAFC has no wins against top teams. SKC still has 6 to go.

Filed Under: 2018 Weekly Updates

Interconference Play 2018 – June Results

July 2, 2018 by Mark Leave a Comment

June 
East Record 5-5-4
At Home 5-0-1
On Road 0-5-3
Goal Differential 0
East Points 16
West Points 18

Season to Date – 74 Games
East Record 33-29-12
At Home 23-11-4 (38 Games)
On Road 10-18-8 (36 Games)
Goal Differential +14
East Points 111
West Points 99

Things remain very tight. Neither conference lost a home game in June.

Filed Under: Interconference 2018

NYCFC Weekly Updates By The Numbers – MLS Week 18 July 2, 2018

July 2, 2018 by Mark Leave a Comment

Hello and welcome to your schedule-driven nickname-heavy midpoint update.

NYCFC started its existence with a 6-game Away winless streak. It then never again failed to win for 6 straight Away games until this weekend. Both six game streaks consist of 4 losses and 2 draws. In between, NYCFC went 19-20-9 Away for 1.375 PPG. NYC’s Away PPG for 2018 is 1.00.

Third in the conference. Sixth in the league by PPG. The Wizards and the Golden Wings are within easy reach. The Burn and the MetroStars have effectively the same record and are a bit more of a stretch, with the difference being the Bluebirds have 2 games coming up with Taurine Pushers that can decide that 1-on-1 race, while the Celestes are done with the southwestern Toros. The Five Stripes have opened a gap and hopes of catching United-C probably depend upon them having an Away slump.

Halfway through 2017 the Gotham Blues had 30 points and fans were excited. Halfway through 2018 the Robber Barons have 31 points and fans are distressed. Progress!
This is the best first half performance for Las Palomas in their historic history to date.
Dividing the season into rough quarters of 9-8-8-9 games, 2018 tied for the worst second quarter of the season for the Blue Notes at 1.375 PPG. That’s the same as 2015, except that in 2015 1.375 PPG was good for this team.
As noted in the prior post, City is currently on a 6-game Away winless streak that matches its worst. Right now the Tenants have an Away record of 1.00 PPG, which is basically league average (0.99) and their worst since 2015. With 8 Away games left, a realistic hope would be to get 11 points 8 games (1.375 PPG) to bring this season’s road performance up to the neighborhood of its historic average. For reference, and we can hope but certainly not expect to match this, the Squatters’ best 8-game Away stretch was 5-2-1 (2.00) in 2016, including a 4-0-1 (2.60) stretch. That was done against tough competition, too. The Home PPG of the teams in the 8-game run was 1.79, and the opponents’ home PPG in the 4-of-5 game core was 1.91. Which probably is a hint that a road streak has more to do with your performance than the quality of the opponent. The home PPG of NYC’s remaining Away opponents is 1.62.

So, getting to 70 is tough to imagine, and even 65 is very hard at this point.
Remaining schedule strength, based on opponent H/A PPG:
ATL 1.27
FCD 1.45
LAFC 1.28
NYC 1.31
RB 1.50
SKC 1.43
The league PPG to date is 1.39.
I know, every one of you is thinking, but Mark, the Swamp creatures’ opposing PPG is inflated because they play the Blue Hawks twice at Yankee Stadium, where City Actual has a league best 2.75 Home PPG, and yet the Ruby Bovines always beat the Ceruleans. Thanks for reminding me. Their adjusted opponent PPG excluding the Cyans is 1.34, which is not that tough, so the 718s better take care of business themselves.

The race for bottom playoff spots in the East is a mad scramble among the desperate, and I have been forced to add Montreal, who started the season losing 10 of their first 13 games yet have passed the Purple Lions and the Chester Conjunction, and are now just below the playoff line behind the Burning Fervor of Chicago. Les Impingements also have no draws through 18 games, which is just weird. The only team not on this chart now is ManU-B.

Filed Under: 2018 Weekly Updates

About Page and My Other Blogs

About and the Rules

Privacy

My Photo Blog

My Dad’s Autograph Collection and Sketches

Other NYCFC Sites

NYCFC Forums

The Outfield

Categories

  • 2015 Weekly Updates
  • 2016 NYCFC Assorted
  • 2016 Weekly Updates NYCFC
  • 2017 Weekly Updates NYCFC
  • 2018 Weekly Updates
  • 2019 Interconference Play
  • 2019 Weekly Updates
  • Interconference 2018
  • Interconference Play 2016
  • Interconference Play 2017
  • Methodologies
  • MLS Assorted
  • NYCFC Misc

Archives

  • September 2022
  • May 2022
  • November 2020
  • October 2020
  • July 2020
  • June 2020
  • October 2019
  • September 2019
  • August 2019
  • July 2019
  • June 2019
  • May 2019
  • April 2019
  • January 2019
  • November 2018
  • October 2018
  • September 2018
  • August 2018
  • July 2018
  • June 2018
  • May 2018
  • April 2018
  • March 2018
  • November 2017
  • October 2017
  • September 2017
  • August 2017
  • July 2017
  • June 2017
  • May 2017
  • April 2017
  • October 2016
  • September 2016
  • August 2016
  • July 2016
  • June 2016
  • May 2016
  • April 2016
  • March 2016
  • August 2015

Recent Posts

  • Goal Differential Minus xGoal Differential – Spoiler: It’s About Cushing
  • NYCFC May 30, 2022 – Odds’n’Ends, Shapes and Contrasts
  • NYCFC 2020 In Review By The Numbers
  • The Best of Times, The Worst of Times
  • NYCFC 2020 – 15 Games In – 8 To Go

Recent Comments

  • JC on NYCFC May 30, 2022 – Odds’n’Ends, Shapes and Contrasts
  • visit this link on Boys Keep Swinging — NYCFC Weekly Update MLS Week 26 September 2, 2019
  • Mark on If Every MLS Team Were A Ride At Disney World
  • Michael B Parker on If Every MLS Team Were A Ride At Disney World
  • If Every MLS Team Were A Ride At Disney World on In My Beginning Is My End – NYCFC Weekly Update October 7, 2019 MLS Week 31

Meta

  • Log in
  • Entries feed
  • Comments feed
  • WordPress.org

Copyright and Disclaimers

Copyright (c) Mark Garbowski 2015-2019. All rights reserved.

I have no ads or commercial interests in connection with this blog so I need no disclaimers.

Copyright © 2023 · Agency Pro on Genesis Framework · WordPress · Log in