City Blues By The Numbers

You are here: Home / 2018 / Archives for September 2018

Archives for September 2018

Interconference Play 2018 – September Results (Excluding September 1)

September 30, 2018 by Mark Leave a Comment

September (excluding September 1)
East Record 9-3-3
At Home 6-2-2 (10 games)
On Road 3-1-1 (5 games)
Goal Differential +12
East Points 30
West Points 12

Season to Date – 97 Games
East Record 53-48-24
At Home 38-16-9 (63 games)
On Road 15-32-15 (62 games)
Goal Differential +15
East Points 183
West Points 168

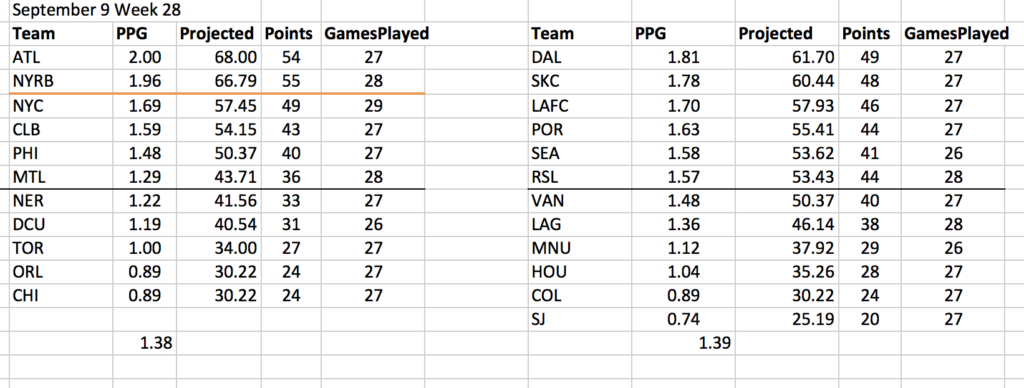
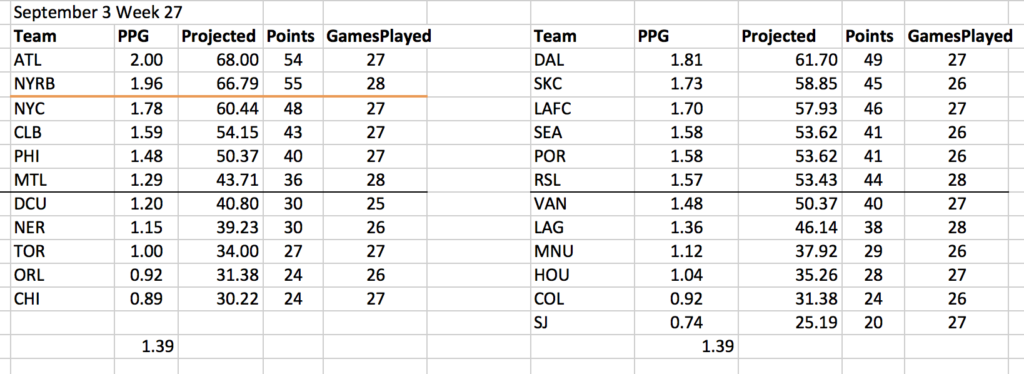
Dominant month by the East, building a comfortable cushion with just 8 interconference games remaining (of which 5 are at Home for the East teams). The East had the benefit of 10 Home games and only 5 Away, but the 3-1-1 Away record was impressive also.  As noted in the prior Interconference Play entry, the East will end with 3 more Home games than the West when the season is over.

Three of the East’s win’s this month were by Atlanta, who finished 7-3-2 against the West.
Red Bulls are 9-2-0 against the West, with one game remaining in San Jose.
NYCFC finished it’s Western slate of games at 6-4-2.  NYC started the season 5-1-0 against the West, and then went 1-3-2.

Filed Under: Interconference 2018

NYCFC Weekly Updates By The Numbers – MLS Week 30 September 25, 2018

September 25, 2018 by Mark Leave a Comment

Distractions

NYCFC’s PPG before the Vieira to Arsenal rumor 2.43
NYCFC’s PPG since
– the Arsenal rumor 1.43
– the Nice rumor 1.53
– Dome took over 1.47
– Eloi first took the field 0.60

This Bad Run

The projected final point total went down by 13. Last year’s slump was either 11 points and 2 wins in 9 games, or 7 points and 1 win in 7, depending on how you define when it started. The team PPG dropped in the 7 games from 1.852 to 1.676 for a 0.175 (math seems off due to rounding) reduction.
This year the slump to date is an easily identified 9-games (so far) with just 7 points and 1 win in the 9 games. The team PPG dropped in the 7 games from 2.048 to 1.667 for a 0.381 reduction.
Last year’s slump coincided with injury to Villa, the team’s only reliable goal scorer in the second half of the season. This year, the slump has a multitude of arguable causes, which both diffuses responsibility yet should be more damning.

Vieira, Torrent, and the Blame Game

NYCFC played 15 games under Viera and now has 15 under Torrent. The Viera schedule included 8 Away and 7 Home, and the Away games included SKC, Portland, LAFC, Red Bulls and Atlanta. NYC also faced Atlanta at home, which was the toughest Home matchup given Atlanta’s Away record this year. Dome’s schedule has had 8 Home and 7 Away. The toughest matchups were Away to Seattle, Columbus and Philly, none ranked higher than 4th in their conference.

NYC under Vieira lost 3 games, earned 28 points, scored 30 goals and conceded 20.
NYC under Torrent lost 5 games, earned 22 points, scored 22 goals and conceded 19.
The idea that losing Herrera had no effect on team defense but killed the team’s offense is counterintuitive at best.

You can blame it on Viera jumping ship, Dome unable to pick up on the fly, or bad luck.
You can blame it on the rain, blame it on Rio, or you can blame it on me Terry, it don’t matter to me now.
But the team scored 27% fewer goals against a much, much easier schedule since Dome took over, and won 21% fewer points.

The Company We Keep
Other teams with one win in the last 9 games, or worse.

Chicago* (one win in eleven) 20
Houston (one win in twelve) 18
New England (one win in twelve) 16
Orlando (one win in twenty) 21
Honorable Mentions
Minnesota** 17 and San Jose 23, both one win in eight games.
The other number next to each team is their place in the Supporters’ Shield standings.

* Hey, we play them this week. Maybe there’s hope.
** Hey, we play them this week, too. OTOH, six of their last 8 have been Away and we play them in Minnesota.

Playoff Seeding Update
Three point lead on Columbus; four point lead on Philadelphia. All three teams have 4 games left.
Columbus
NYC has 1 more win. If they tie on points they likely end up tied on wins as well. NYC currently has a +12 GD advantage.
Philadelphia
Teams are tied on wins. If they tie on points the Union likely ends up with more wins. NYC currently has a +15 GD advantage, FWIW.
Schedule
Home games in CAPS:
NYCFC plays CHICAGO, Minnesota, DC United, PHILADELPHIA
Columbus plays PHILADELPHIA, Montreal, Orlando, MINNESOTA
Philadelphia plays Columbus, MINNESOTA, RED BULLS, New York City

The Columbus schedule is easiest. The NYC and Philadelphia schedules are close in difficulty, with the advantage to NYC since they play each other in the Bronx (or maybe Queens). But it is best if the Union is disposed of before then. Best case scenario is if NYC can beat Chicago midweek, and Columbus beats the Union on the weekend. That’s a 7-point lead over the Union with 2 games for each before the H2H on decision day. Then, if NYC can just draw 1 of the 2 Away games, the Union would need to win both of its home games, including against the Red Bulls, to have a shot. A win and a draw for the Union in those games would leave them 4 points back going into the last game. If NYC could win one of its Away games (plus the best case scenario) then it will have clinched over the Union. Basically, any combination of NYC wins and Union losses that adds up to 3 will clinch*** 4th Place for NYC, and that almost has to start with a win over Chicago on Wednesday, and if so, it could wrap up by Saturday.
Maybe I will go Wednesday night.
*** Technically, DC, Montreal and New England have to be dealt with also, but the scenarios where any of them survive while the Union is eliminated are quite unlikely.

Apart from everything else, I really wanted 60 points this year, regardless of where the team finished. And it seemed so likely for so long.

Filed Under: 2018 Weekly Updates

NYCFC Weekly Updates By The Numbers – MLS Week 29 September 18, 2018

September 18, 2018 by Mark Leave a Comment

Short update with no NYCFC action this week.


While standing still, NYC gained a little ground looking both up and down at Red Bulls and Columbus. Catching RB would still take a Red Bull slump, while the cushion over the Crew is a bit more comfortable.Montreal’s win over the Union makes dropping to Fifth much less likely, avoiding an Away single game elimination.The Impact win also put pressure on DC, who has to win both games in hand now to stay just ahead of them.
Looking West, the LAFC tie dropped them from just above to just below NYC, and the Dallas draw with Columbus made catching them a bit easier as well. Still, passing FCD or SKC will be tough and if NYC turns itself around and makes a run to the MLS Cup final, the game might very well be in the Central Time Zone.
Finally, here is how NYCFC can clinch by beating Montreal this week.  NYC has already clinched ahead of TFC, CHI, and ORL.  If NYC wins that’s 52 points. A corresponding Montreal loss drops their max to 51.  That’s four. New England’s max is 52, but even if they get that by winning all of their remaining games, they will only have 14 wins while NYC will have 15 with the win over the Impact and total wins is the first tie-breaker. That puts NYCFC ahead of 5 teams no matter what and that is a clinch.

Filed Under: 2018 Weekly Updates

NYCFC Weekly Updates By The Numbers – MLS Week 28 September 10, 2018

September 14, 2018 by Mark Leave a Comment

NYCFC has just 6 points in its last 8 games. The last 8-game stretch as bad or worse than that was in the club’s first season, 2015, when they finished at 1.08 PG overall. For those wondering, the first 8 games of 2016 earned 7 points.
NYCFC has 33 points in its last 23 games. To find a 23-game stretch that bad you also have to go back to 2015. You can select the first 22 games of 2016 plus the last 1 of 2015, which yielded the same 33 points. If you want a 23-game run in one season, you have to go to the last 23 games of 2015, which generated 30 points.

So it is fair to say this team has had both its worst medium length run of games and worst extended run since its first season, which until now has seemed to be an aberration which never again needed to be revisited. NYCFC has never been so bad for so long since Kreis and a hideous roster forced on us by rules that were abandoned immediately afterwards.

But it is also fair to point out that the team’s best 6-game run this year came at the very beginning, which lends itself to corresponding longer runs of poor, or at least mediocre play. Historically, this team has previously always had its best run around midseason.

Best 6-games of 2015 – 13 points games 14-19
Best 6-games of 2016 – 15 points games 14-19
Best 6-games of 2017 – 13 points games 15-20
Best 6-games of 2018 – 16 points games 1-6
(A note about all such streaks- there is often some wiggle room to choose the best 6 on either side of a 3-4 game core).

I don’t think there is any reason why the best streak happened in games 1-6 this year instead of the usual time. So maybe that’s driving the perception of 2018. Yes, you can point to the coaching instability and transition, which coincidentally started with the Arsenal rumors after Game 7 as the reason for the falloff (and I have so pointed), but that also cannot be the reason why the club had its best ever 6-games just before those rumors started. The club could easily have been its regular pretty good self during those early games, instead of its best ever 6-games.

It is also interesting that the club had its best ever second-best-non-overlapping-6-game-run in 2018. Games 16-21 (right around mid-season again) earned 15 points, which is also as good or better than the first best 6-game sets of all prior seasons. The second-best-6-games in 2015-17 earned 9, 11, and 13 points in order.

One more thing: the team’s PPG in the games left after you back out the best-6 and next-best-6 is as follows:
2015 0.68
2016 1.27
2017 1.41
2018 1.06

This is a bit unfair to 2018 because it has only 17 games instead of 22 after excluding that pair of 6-game sequences. Maybe the club does get better in the last 5 games left and this improves. But for now, it is fair to say that in 2018 there has been a greater disparity between the best and worse, and more of a roller coaster effect, than any year after 2015, which is pretty much an outlier that I think most agree can be ignored for purposes of interesting comparisons.

Here are the charts. NYCFC is down to 6th in PPG, though just barely behind LAFC.

Remember when 64 points seemed a more than reasonable goal? Now it is the best that can be done.

The rolling 5-game PPG tells an ugly story.

Columbus has an opening to catch NYC. Philadelphia has an outside shot. If the Union wins both extra games – which is by no means a gimme – it is still 3 points back. The DC-Montreal-Revs race looks like it could come down to the final weekend.

Final note: NYC has the hardest remaining schedule except for Colorado. NYC’s H/A adjusted opponents’ PPG is 1.60. NYCFC’s weakest Away Game opponent is Minnesota at 1.92 PPG. They also face Montreal 2.00 PPG and DC 2.20 PPG.

Filed Under: 2018 Weekly Updates

NYCFC’s 12 months of Sort-Of-Good.

September 4, 2018 by Mark Leave a Comment

Last year NYC finished the season very poorly, with just 7 points in the final 7 games. So unless the current very poor run continues, the 2018 version is likely to outperform 2017, by a small bit probably.

But another way of looking at it is that NYCFC is basically a good but not very good team over it’s last 34 regular season games, and just mediocre with the exception of the 5-0-1 start of this year. In the last 34 games NYCFC is 15-9-10 for 55 points and 1.62 PPG. Back out the first 6 games of this year, and NYCFC is just 10-9-9 for 39 points over 28 games, and a weak 1.39 PPG.

As I’ve said multiple times lately, it is unfair to exclude any team’s best run of 5-8 games from it’s record, but I also think this demonstrates that following this team has been has been very disappointing, compared to expectations, for an entire year now, alleviated by just 6 good weeks in March-April this year. There was another nice run driven mostly by playing 6 of 7 at home, fully offset by the times when we played mostly Away. Really the only time this team has looked like it could be excellent in the last 12 months — both home and away — was a month and one-half at the start of this year.  EVen including those best 6 games, 55 points is basically “best of the rest” after you exclude the top 2-3 teams each year. It is also a team that has not shown meaningful improvement since its 54-point 2016 campaign.

Throw in the playoff loss and USOC failure, and, this does not look anything like an elite team. It’s a good team, but not elite. NYCFC fans reasonably expected an elite team in 2018 and it has not happened.

Filed Under: NYCFC Misc

NYCFC Weekly Updates By The Numbers – MLS Week 27 September 3, 2018 (Rashomon Edition)

September 3, 2018 by Mark Leave a Comment

  1. NYCFC started the season with an unbeaten 5-0-2 run of 7 games for 2.43 PPG. Since then, they are just 9-7-4 in the most recent 20 games, for 1.55 PPG, which would be just 52.7 points if done over a full season. A playoff team, but worse than last year. Still, the first 7 games count, and you should not discount them just because of timing. Remove any club’s best 7-game stretch from the season and they look much worse.
  2. NYCFC started the season with an unbeaten 5-0-2 run of 7 games for 2.43 PPG. Then the Patrick Vieira to Arsenal rumors started. Since then, the team’s PPG is 0.88 lower than it was before Patrick became distracted. The club never really recovered.
  3. NYCFC started the season with 1.91 PG through 11 games, of which only 4 were at home. It was a brutal schedule to begin, and NYCFC managed 2 Away wins, plus impressive road draws against Atlanta and LAFC (with a clinker in Harrison mixed in). Still, they were poised to start a run through the easiest part of their schedule when the Vieira to Nice rumors started on May 15. Since then they earned just 1.69 PPG despite playing 2 more Home than Away games.
  4. Patrick Vieira had the club playing well through the first 15 games before he left. The team PPG was at 1.87, and his last game, though only a draw, was perhaps the best game the team played all year, thoroughly dominating Atlanta in Yankee Stadium in all areas except finishing. Since then the team has tread water under new coach Dome Torrent, earning a respectable if mundane 1.67 PPG.
  5. NYCFC dominates at home, benefiting from an extreme home field advantage due to the uniquely small field. Conversely, they flounder away, where they concede 3.85 times as many goals per game as they do at home [0.54 GA/g Home, 2.07 GA/g Away].
  6. NYCFC started extremely well, but then settled into a pattern of winning at home while struggling on the road, until a series of ridiculous travel games, injuries, and red cards, cursed them to a streak of 5 points in 6 games, and facing 2 upcoming games with further players unavailable due to international call-ups. For the first time they are lower than they were after the same number of games in 2017, and also are at risk of finishing below their point total from the year before, which has never happened to date. The circumstances are a combination of bad luck, possibly poor training methods, and poor roster construction over-reliant on injury-prone players and mid-range national team roster fillers more than any issues regarding the coaching staff or player performance.

Filed Under: 2018 Weekly Updates

Interconference Play 2018 – August Results (Plus September 1)

September 3, 2018 by Mark Leave a Comment

August + September 1 
East Record 5-4-4
At Home 4-1-1 (6 games)
On Road 1-3-3 (7 games)
Goal Differential +1
East Points 19
West Points 16

Season to Date – 97 Games
East Record 44-45-21
At Home 32-14-7 (53 games)
On Road 12-31-14 (57 games)
Goal Differential +3
East Points 153
West Points 156

This includes the September 1 games, which avoids breaking a week into separate months, and simplifies my record-keeping. The East had a mildly good month, winning 1 more than it lost in a month where the West had 1 extra home game. Overall, the West has 1 more win than the East, having played 4 more Home games, while the East has a +3 Goal Differential.
Looking ahead, I count 23 more games for 133 total. I believe this is correct, even though an odd number. If the 11 teams in the East played each of 12 West teams once that would be 132 games. It turns out Vancouver plays Montreal twice. What is further odd is that the East will finish with 68 home games to just 65 for the West. This is doubly odd because we know that NYCFC plays 7 Away to only 5 at Home against the West this year, so other East teams must play cumulatively 5 extra homes games to balance it out and make the numbers work. I presume all of this unbalance is done to offset existing unbalance due to have one more team in the West this year.

Filed Under: Interconference 2018

About Page and My Other Blogs

About and the Rules

Privacy

My Photo Blog

My Dad’s Autograph Collection and Sketches

Other NYCFC Sites

NYCFC Forums

The Outfield

Categories

  • 2015 Weekly Updates
  • 2016 NYCFC Assorted
  • 2016 Weekly Updates NYCFC
  • 2017 Weekly Updates NYCFC
  • 2018 Weekly Updates
  • 2019 Interconference Play
  • 2019 Weekly Updates
  • Interconference 2018
  • Interconference Play 2016
  • Interconference Play 2017
  • Methodologies
  • MLS Assorted
  • NYCFC Misc

Archives

  • September 2022
  • May 2022
  • November 2020
  • October 2020
  • July 2020
  • June 2020
  • October 2019
  • September 2019
  • August 2019
  • July 2019
  • June 2019
  • May 2019
  • April 2019
  • January 2019
  • November 2018
  • October 2018
  • September 2018
  • August 2018
  • July 2018
  • June 2018
  • May 2018
  • April 2018
  • March 2018
  • November 2017
  • October 2017
  • September 2017
  • August 2017
  • July 2017
  • June 2017
  • May 2017
  • April 2017
  • October 2016
  • September 2016
  • August 2016
  • July 2016
  • June 2016
  • May 2016
  • April 2016
  • March 2016
  • August 2015

Recent Posts

  • Goal Differential Minus xGoal Differential – Spoiler: It’s About Cushing
  • NYCFC May 30, 2022 – Odds’n’Ends, Shapes and Contrasts
  • NYCFC 2020 In Review By The Numbers
  • The Best of Times, The Worst of Times
  • NYCFC 2020 – 15 Games In – 8 To Go

Recent Comments

  • JC on NYCFC May 30, 2022 – Odds’n’Ends, Shapes and Contrasts
  • visit this link on Boys Keep Swinging — NYCFC Weekly Update MLS Week 26 September 2, 2019
  • Mark on If Every MLS Team Were A Ride At Disney World
  • Michael B Parker on If Every MLS Team Were A Ride At Disney World
  • If Every MLS Team Were A Ride At Disney World on In My Beginning Is My End – NYCFC Weekly Update October 7, 2019 MLS Week 31

Meta

  • Log in
  • Entries feed
  • Comments feed
  • WordPress.org

Copyright and Disclaimers

Copyright (c) Mark Garbowski 2015-2019. All rights reserved.

I have no ads or commercial interests in connection with this blog so I need no disclaimers.

Copyright © 2023 · Agency Pro on Genesis Framework · WordPress · Log in