City Blues By The Numbers

You are here: Home / 2018 / Archives for October 2018

Archives for October 2018

It’s All In The Framing: A Response to Dummy Run

October 31, 2018 by Mark 1 Comment

The pseudonymous Dummy Run over at Twitter  wrote the NYCFC Playoff Preview for ASA. Dummy is no dummy, and the article is great. It is also long. It is dense. It has a lot of charts. I mean, even by his standards, it is chart heavy. You will learn a lot. Go read it. Maybe twice. There is a lot of good stuff there.

But I have one big problem. Really big. The first chart in the article is a Vieira/Torrent comparison, covering many regular and advanced stats, and it shows that NYCFC is better under Torrent on basically all the advanced stats while behind on the regular ones. This is known as bad luck. This point frames his entire discussion, which covers so much more, including how NYCFC responds o pressure when it plays from the back, how it transitions into attack, and identifying specific style differences in play under Vieira and Torrent, all illustrate with graphs, charts, and video. The opening and closing theme of the piece is that Dome had the team playing better and it was bad luck that the results did not follow.

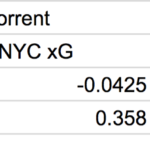
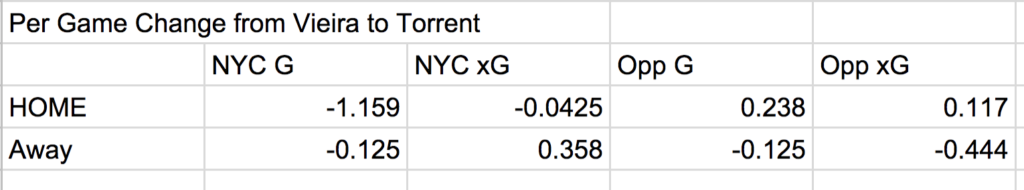
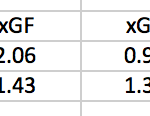
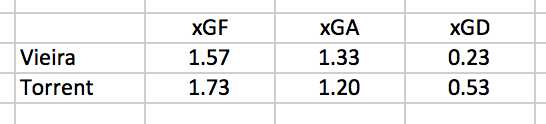
But. This is a big but. And I’m disappointed Dummy didn’t notice this, or actively chose to ignore it, but the frame he imposes — comparing all of Vieira’s games to all of Torrent’s games, masks the extreme seesaw nature of Torrent’s time at NYCFC.  As Dummy lays out in the chart I mentioned (it’s the ones with the photos of Vieira and Torrent) , Expected Goals For NYCFC went up from 1.57 to 1.73 when Dome took over, and Expected Goals Against went down from 1.32 to 1.17. So the team got better, right?  Here’s a simpler table with just those stats (some of my numbers are just slightly different because of different rounding algorithms I think):

Yay better. All good. But let’s compare these 2 coaches:

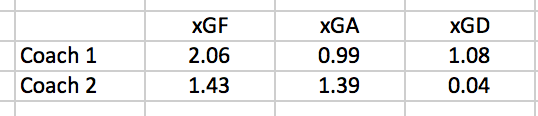
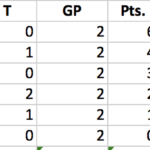
Coach 1 has results better than Torrent. Coach 2 is worse that Vieira. And — big reveal — they are both Dome Torrent, split between his his first 9 games (through the Toronto Away game) and his last 10 when the team was much worse. According to Expected Goals, the longer Torrent was in charge, the worse NYCFC played. The results were not bad luck. They matched the run of play. The only reason Dome’s results look better than Vieira’s is that before he changed things up so much, and brought in his guys, the team had it’s best xG run of the season. So the ASA article basically masks the correlation between advanced stats and results by treating Dome’s 19 games as a consistent run of play, which they were not. There was no bad luck. The team had good results for Dome when xG says they played well, and poor results when they did not. In Torrent’s first 9 games with an Expected Goal Differential of +1.08 the team went 6-2-1 for 2.11 PPG.  Then when the same differential dropped to +0.4 the team went 2-5-3 for 0.90 PPG.

The Home and Away splits show that the big difference was Away, though the team got worse at Home also.
First, Home. “Dome” is his record as a whole. “Dome1” represents his first 5 Home games, “Dome2” his last 5:

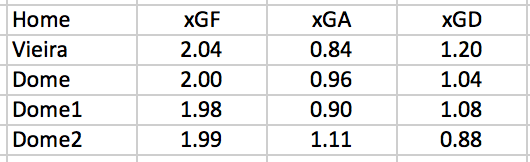
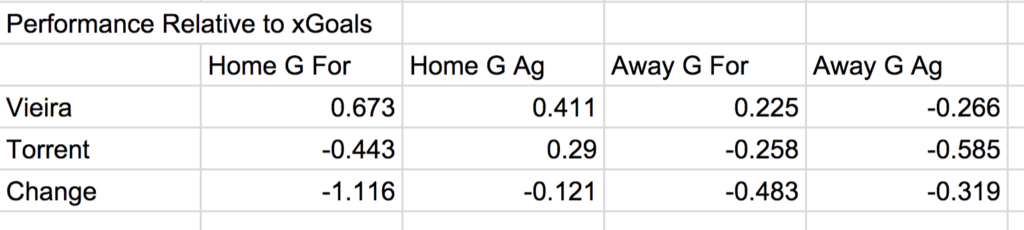
It is pretty consistent, but though the differences are small, the team actually performed better under Vieira, and the Expected Goals Against did increase by a meaningful amount in the final quarter of the season under Dome. In sum, Home defense got worse, according to Expected Goals.

Now Away. NYCFC played 9 games Away under Dome. The Dome1/2 split is First 4, last 5.

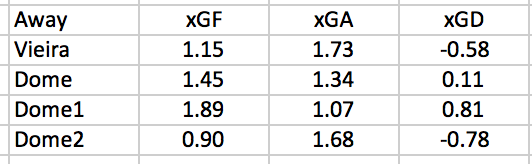
Holy crap on a stick. At first, NYCFC improved a lot on the road when Dome took over, and you may remember they won 2 Away games after a long dry spell. Arguably they should have done even better. The Expected Goal DIfferential for the 2 losses in this set of games was +0.88 (Chicago) and +0.99 (Seattle). But after that, Expected Goals For went down an entire goal per game from 1.89 to 0.90. That’s massive. At the same time, Expected Goals Against went up by 0.6 for a swing of 1.59 in Expected Goal Differential in the wrong direction between the first half of Torrent’s tenure and the second half playing Away.

What excuses are there for this? Schedule? Injuries? I cannot go with injuries because the first half of Torrent’s time coincides almost perfectly with Villa’s long absence, while the crap run overlaps with a missing Medina. That doesn’t really explain anything.

Finally, I understand that 5 and 4 game samples are really small (although that is just the H/A breakdown).  Maybe Dome had an anomalously great short run to start, then a similar bad run. Maybe next year averages out all good. But the thesis that Dome simply improved the team and the poor results do not coincide with how he had the team playing does not hold up when you break it down. When you change the framing from (1) Vieira vs Torrent to (2)Torrent’s Good Start vs Torrent’s Bad Finish you see that Dome pretty much got the results he deserved. He won when the team played well, and lost when they deteriorated. That’s true whether you go by the eye test or xG, and bad luck doesn’t really play into it. Maybe the team deserved to win a little more over the last 10, as the xGD was barely on the positive side overall. But when play objectively worsens, I’m not very sympathetic to the complaint that results should not have been quite as bad as they were. Expected goals says NYCFC certainly did not deserve a strong record at the end of the season, and any analysis of Torrent has to consider why the team did so much worse the longer he was in charge.


Filed Under: NYCFC Misc

NYCFC Playoff Seeding Status Summary

October 8, 2018 by Mark Leave a Comment

Current Position: Third 53 Points
Unable to Climb Higher
Remaining Games at DC United, Home Philadelphia Union. H/A adjusted Opponents’ PPG 1.80 (second hardest)

Teams Who Can Catch NYCFC
1. DC United
12 points back, 4 games to play.
Home Dallas, Home TFC, Home NYCFC Away Chicago. H/A adjusted Opponents’ PPG 1.11 (7th easiest-tie)
DCU has to win out, and NYCFC lose out. That will put them tied on Points and Wins. GD status currently NYC +14, DCU +6. But if NYC loses out and DC wins out, NYC will be at most +12, and DCU at least +10. So DC would have to pick up an additional 3 GD, either by winning by >1 or NYC losing by >1, and then DC leads here. Next tiebreaker is Goals For. Teams are current tied, so if DC makes up the points deficit they would win this tiebreaker, meaning they only need to pick up an additional 2 GD to win.
Bottom line: any result for NYC or dropped points for DC and NYC stays ahead. Barring that, however, tiebreakers favor DC.

2. Columbus
5 points back, 2 to play.
Away Orlando, Home Minnesota. The easiest remaining schedule in the league. H/A adjusted PPG 0.79.
The Crew have to win both to have a chance, but the schedule is ridiculously easy. If they win out and NYC gets 1 point it is a tie. Any NYC win clinches. If they draw on points they will be tied on wins. Crew GD is -2, which is 16 behind NYC, so they have to win each game by 7-9 goals to overtake NYC.
Bottom line: any result for NYC or dropped points for Columbus and NYC stays ahead, given the tiebreakers, with a minuscule chance of Columbus winning a GD tiebreaker.

3. Philadelphia
3 points back, 2 to play.
Home Red Bulls, Away NYCFC. Adjusted H/A Opponents’ PPG 1.94.
The Union need at least to match NYCFC in Week 33 and then control their destiny on Decision Day. If they fall behind by one more point it is over. If the teams finish tied on points, Philadelphia will have more wins.
Bottom line: getting more points than the Union in Week 33 is key.

Summary:
I’m just assuming Columbus beats Orlando and Minnesota. OTOH, if DC drops points in the next 2 games against Dallas and Toronto, that solves DC. But even assuming DC wins the next 2:

A win in DC guarantees that NYC finishes ahead of DC and Columbus, and no lower than 4th.
A draw in DC guarantees NYC finishes ahead of DC and no lower than 5th. If Red Bulls also beat the Union, then NYC finishes no lower than Fourth. If Orlando beats or even draws Columbus the world ends, but NYC finishes ahead of the Crew as well. Also NYC finishes ahead of CLB in GD tiebreaker barring oodles of goals by Columbus.
A Loss in DC means Decision Day is really scary, unless (1) DC first drops points to either Dallas or Toronto, and (2) Columbus drops points to Orlando.

Filed Under: 2018 Weekly Updates, NYCFC Misc

Exploring the Reasons For NYCFC’s Disappointing Second Half Under Dome Torrent

October 6, 2018 by Mark Leave a Comment

I started looking into Vieira/Torrent splits and found some interesting things. Some offer obvious conclusions, but others not so much.

All NYCFC defensive actions this season under Patrick Vieira versus Dome Torrent. pic.twitter.com/KfKHc9MCth

— Dummy Run (@thedummyrun) October 6, 2018

Click on the images in that tweet and you will see that NYCFChas been much more active on defense under Torrent. His graph does not seem to offer a H/A split, but I think it is likely most of this activity is in Away games.

At home, every number has moved in the wrong direction. Home goals per game and xGoals per game are both down (though the latter by an insignificant amount). Also at home, opponent Goals and xGoals have gone up.

Away, however, NYC goals are down but xGoals are up by a meaningful amount. Opponents goals also are down, while their xGoals are way, way lower.
Under Vieira in 2018, NYCFC gave up an average of 1.7625 xGoals per game Away, and that is down to 1.2975 under Dome. Under Vieira, road opponents never accumulated fewer that 1.4 xG per game in 8 games. Under Torrent, they only exceeded 1.4 xG twice in 8 games.

This chart also shows that in all 4 areas: Home goals for and against, and Away goals for and against, the actual goal change has been worse for Dome than the xGoal change.

I do believe that the improvements in Away xGFor and xGAgainst are big enough that it shows real improvement, especially because Torrent has discussed his emphasis on improving road form. NYCFC’s xG differential has improved by 0.801 per game on the road. I tend to give people credit when they say “my goal is to improve X” and then X improves.

Next I focused on how NYCFC has performed relative to xGoals under Vieira and Torrent. The results are not surprising given the table above, and everything we have seen and discussed the last 2 months.

First 2 lines show the difference between actual goals per game and xGoals per game. In every instance + means the team did better than expected and – means the team did worse than expected. This is where the big dispute comes in regarding whether you think performance relative to Expected Goals is mostly luck, or not. Because again in all 4 categories the team was “luckier” under Vieira than for Torrent, and for NYCFC’s Home goals scored, the difference is massive. Can bad luck be this consistent? I honestly don’t know. Logic cuts both ways. On one hand it seems unlikely that luck would point the same way in all contexts and subdivisions, unless there was a reason outside of luck. On the other hand, there is no reason why the non-lucky explanations should correspond with each other. For example, you might explain the poor results relative to xG scored as being due to a less aggressive, vertical offense in transition. But just because that is true does not suggest a substantive reason for why the club should also underperform on defense. Whether you think it is luck, or there are substantive explanations, you might expect them to be independent.

For additional context, I note that for the entire season, only 5 MLS teams are underperforming relative to xGoals at home. That’s pretty normal. In 2017 6 teams did that, in 2016 – 5, 2015 – 8, and in 2014 – 4 teams. Simply put: Most teams outperform xGoals at Home. Further, underperforming xG at home by -0.443 per game is very unusual. Since and including 2014 through 2018 to date, only 4 teams have underperformed xG by worse than -0.3 per game over an entire season. Now, Dome’s NYCFC team has done this over just 9 Home games, not a full season. Extreme and unusual results are more likely over half seasons than over full seasons. But I still think it is fair to say this result is anomalous. Being so much worse at scoring Goals at Home than accumulating xG is just wrong and unusual.

As a bit more background, it is not unusual for a team to have a wild swing in its performance relative to xG in the middle of a season. For example, here are the GD-xGD figures for 2016 NYCFC and 2017 FCD in the first 17 games compared to the last 17 games:

NYCFC 2016 GD-xGD -0.176/0.759 Swing 0.935
FC Dallas 2017 GD-xGD 0.410/-1.091 Swing 1.501

And here is the split and swing for 2018 NYCFC under PV and under DT:
NYCFC 2018 PV/DT GD-xGD 0.484/-0.478 Swing 0.962

GD-xGD combines both offense and defense, and Home and Away. Are these big swings due to luck or something else? You can explain 2016 NYCFC based on the team getting used to PV’s new system. You can explain this year with the coaching change. I confess I am less familiar with 2017 FC Dallas than either NYCFC iteration, but they had no coaching change and they had an important player, Mauro Diaz, return from injury about 40% into the season. Yet they had an enormous negative swing with no clearly obvious cause. So is it mostly luck, really? Are the NYCFC splits that seem to be based on coaching changes just a pair of big coincidences?

Also, The H/A weighted PPG of opponents facing PV was 1.42, and for Dome to date it is only 1.30. But Dome had more injuries, and a lot of odd double game weeks and rough travel.

I think the data supports enough variations in conclusions that people can argue, but I believe the following with various degrees of confidence.

I think the improved xG figures, on both offense and defense under Torrent, represent something real.
I believe the deteriorated results relative to xG is based both on luck and controllable factors.
I think Torrent has focused on Away form, and controlling possession in the midfield, and defending in the midfield.
I think the poor results relative to xGoal is based on lack of performance in the final third on both ends.
I believe NYCFC’s attack is less direct and gives teams more time to get in front of their goal.
On defense, I look at 3 of the worst games relative to xG (at Chicago, at Seattle, and at Minnesota), and can remember individual plays where an opponent broke us down and/or an NYCFC defender messed up, leading to easy goals against the run of play.
I think this combination of effects can be in sum caused by a team that is uncertain of how to play a new system, combined with a technical emphasis on midfield play.
I fully expect this to improve.
Despite a half-season under the new coach, I believe that whether this does or does not improve in time for the playoffs will mostly be luck, if only because of a super small sample size.
I strongly expect this to improve next year.
I fear it might not improve early, due to roster turnover and a guess that Dome is — believe it or not — holding back, and that next year will bring even more changes for the team to acclimate itself to.

Filed Under: NYCFC Misc

A Comparison of Two MLS Midseason Coaching Changes 2018

October 1, 2018 by Mark Leave a Comment

Both Red Bulls and NYCFC lost coaches this midseason.*
Both clubs are part of worldwide soccer organizations.
Both Red Bull GmbH and CFG have adopted a uniform playing style for all of their organizations and boast of plug’n’play interchangeability for coaches and players.
Jesse Marsch spent part of his 3.5  years at RBNY training his replacement.
Patrick Vieira spent the last 3 months of his 2.5 years at NYCFC looking for another job and took his most trusted assistants with him.
Marsch left RBNY under terms set by Red Bull GmbH.
Vieira left against the wishes of CFG.
Red Bull GmbH has a plan for all of their clubs and personnel.
CFG hired Pep Guardiola for Man City and left Vieira twisting in the wind when he saw they were working on a Pep extension.
Red Bull GmbH brought Marsch in as an assistant to their flagship club after 3.5 years at RBNY and elevated his RBNY assistant who knew that team well.
CFG let Vieira walk after 2.5 years because they had no plan for him to move forward, then hired Pep’s Man City assistant for NYCFC, who was unfamiliar with NYCFC, and has publicly expressed confusion about MLS scheduling and other quirks. He then tinkered with a team that was 15-9-8 when he arrived to the point where they have managed to earn less than a point per game over their last 11 chances.
Armas just coached a game without his two most important players (not by his choice) against the best team in the league and won 2-0.
Torrent just coached a game without his 2 most important players (by his choice) against the 16th best team in the league and lost 2-1.
RBNY earned 32 points in 16 games under Marsch, 2.00 PPG.
RBNY earned 30 points in 15 games under Armas, 2.00 PPG.
NYCFC earned 28 points in 15 games under Vieira, 1.87 PPG.
NYCFC earned 25 points in 17 games under Torrent, 1.47 PPG.

RBNY and Red Bull GmbH had a plan for RBNY. CFG/NYCFC have a plan for Man City, and afterthoughts for NYCFC. Sure, maybe Torrent and NYCFC turn it around for the playoffs. There’s no sign of that but it could happen. Even if it does, though, the CFG claims of interoperability and synergy have been revealed as a joke, and as nothing more than vacuous corporate jibber jabber.


*   I realize other teams have changed coaches during this season. But all the others (except Orlando) have come late in the year and all others, with no exception, were due to the more common situation of firing someone for basic poor performance.

Filed Under: NYCFC Misc

NYCFC Weekly Updates By The Numbers – MLS Week 31 October 1, 2018

October 1, 2018 by Mark Leave a Comment

After starting the season 5-0-2, 17 points in 7 games, NYCFC needed to get just 43 points in 27 games, or 1.5926 PPG, to reach the 60 point mark. As late as Game 21, NYC was at 2.048 PPG with a 13-4-4 record and 43 points. They needed just 17 points in 13 games or 1.3077 PPG to get 60 points. After getting only 10 points in 11 games, that is now impossible. The most NYCFC can get is 59 points, if it wins both of its remaining games. Here are all the possibilities.

In 2016, NYCFC looked like a team that overcame a slow start to build a record just short of excellent.
In 2017, NYCFC looked like a team that suffered a late season slump caused by an injury to their only reliable scorer and fell just short of excellent.
In 2018, NYCFC looks like a team that has been treading water for 3 years.

Filed Under: 2018 Weekly Updates

About Page and My Other Blogs

About and the Rules

Privacy

My Photo Blog

My Dad’s Autograph Collection and Sketches

Other NYCFC Sites

NYCFC Forums

The Outfield

Categories

  • 2015 Weekly Updates
  • 2016 NYCFC Assorted
  • 2016 Weekly Updates NYCFC
  • 2017 Weekly Updates NYCFC
  • 2018 Weekly Updates
  • 2019 Interconference Play
  • 2019 Weekly Updates
  • Interconference 2018
  • Interconference Play 2016
  • Interconference Play 2017
  • Methodologies
  • MLS Assorted
  • NYCFC Misc

Archives

  • September 2022
  • May 2022
  • November 2020
  • October 2020
  • July 2020
  • June 2020
  • October 2019
  • September 2019
  • August 2019
  • July 2019
  • June 2019
  • May 2019
  • April 2019
  • January 2019
  • November 2018
  • October 2018
  • September 2018
  • August 2018
  • July 2018
  • June 2018
  • May 2018
  • April 2018
  • March 2018
  • November 2017
  • October 2017
  • September 2017
  • August 2017
  • July 2017
  • June 2017
  • May 2017
  • April 2017
  • October 2016
  • September 2016
  • August 2016
  • July 2016
  • June 2016
  • May 2016
  • April 2016
  • March 2016
  • August 2015

Recent Posts

  • Goal Differential Minus xGoal Differential – Spoiler: It’s About Cushing
  • NYCFC May 30, 2022 – Odds’n’Ends, Shapes and Contrasts
  • NYCFC 2020 In Review By The Numbers
  • The Best of Times, The Worst of Times
  • NYCFC 2020 – 15 Games In – 8 To Go

Recent Comments

  • JC on NYCFC May 30, 2022 – Odds’n’Ends, Shapes and Contrasts
  • visit this link on Boys Keep Swinging — NYCFC Weekly Update MLS Week 26 September 2, 2019
  • Mark on If Every MLS Team Were A Ride At Disney World
  • Michael B Parker on If Every MLS Team Were A Ride At Disney World
  • If Every MLS Team Were A Ride At Disney World on In My Beginning Is My End – NYCFC Weekly Update October 7, 2019 MLS Week 31

Meta

  • Log in
  • Entries feed
  • Comments feed
  • WordPress.org

Copyright and Disclaimers

Copyright (c) Mark Garbowski 2015-2019. All rights reserved.

I have no ads or commercial interests in connection with this blog so I need no disclaimers.

Copyright © 2023 · Agency Pro on Genesis Framework · WordPress · Log in