City Blues By The Numbers

You are here: Home / Archives for 2018

Archives for 2018

NYCFC Roster Building 2018-2019: Who Scores The Goals?

November 30, 2018 by Mark 1 Comment

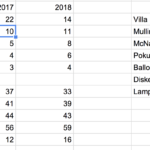
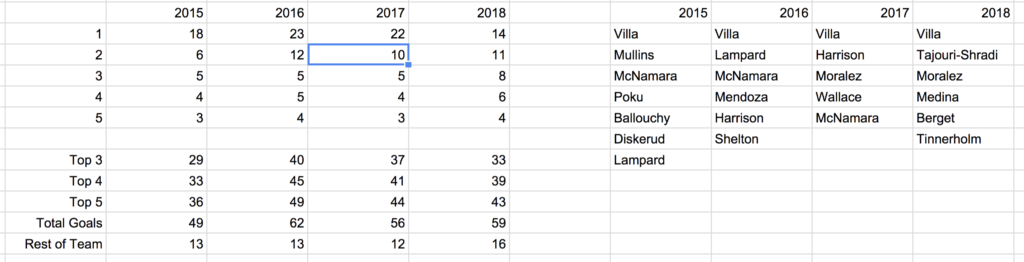
In 2017 NYCFC had terrible production from Spots 3, 4 and 5 in its team goal scoring ranking.  Spot Number Two didn’t shine either. Every one of those spots improved in 2018.  This was the best the team ever got from scorers ## 3 and 4 and #5 tied for its best. The “Rest of Team” category also had an all-time best year for NYCFC. All of this is why the team scored more goals than 2018 despite an 8-goal drop in production by Scorer #1. On the other hand, that drop is why the team did not set a club record for goals scored despite improvement team-wide except for the top guy.
I think it is fair to conclude that Reyna et al set out to improve the team’s scoring capability beyond Villa and succeeded, but I don’t think the plan was for Shradi (total salary $350k) to outscore Berget ($817k) and Medina ($771k) combined.  I’m also concerned that Shradi completely outperformed his Expected Goals by a huge amount and his Goals per Shots Taken was a similar off the chart outlier.  He could outperform all metrics at a similar level next year, but that seems very unlikely. I won’t be shocked if he matches  even exceeds his total numbers next year, but if so, it will probably be because he plays a lot more minutes (just 1547 in 2018, fewer than Villa even).  I can’t see his pace keeping up.
Also, Maxi had a career year.
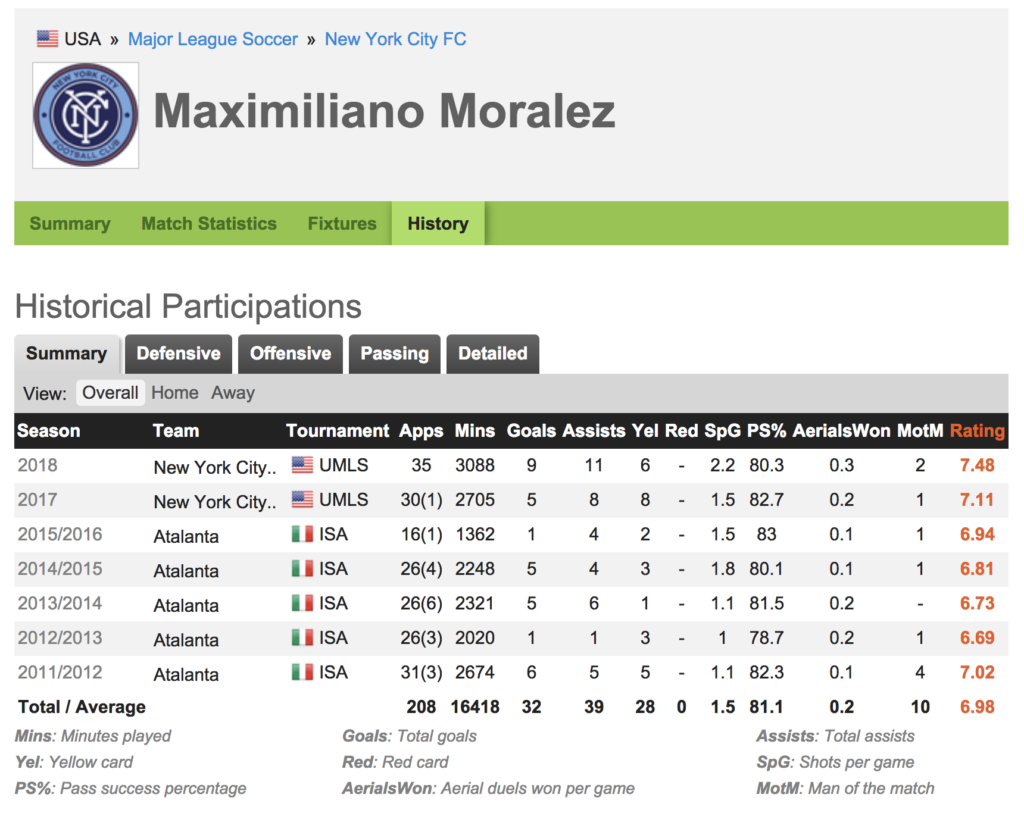
Both his goals and assists were twice his prior career average. Maybe that is who he is now, but again, I do not think we can count on it.
Which means, I think, the club has to get another stud to be the team’s best scorer (and/or Medina and Berget need to be upgraded or just be better) to compensate for what I expect to be decreased production in 2019 from ITS and Maxi.
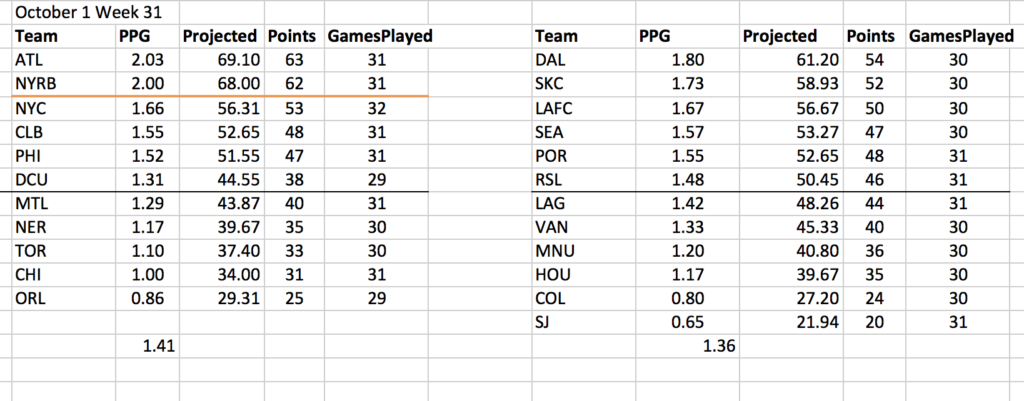
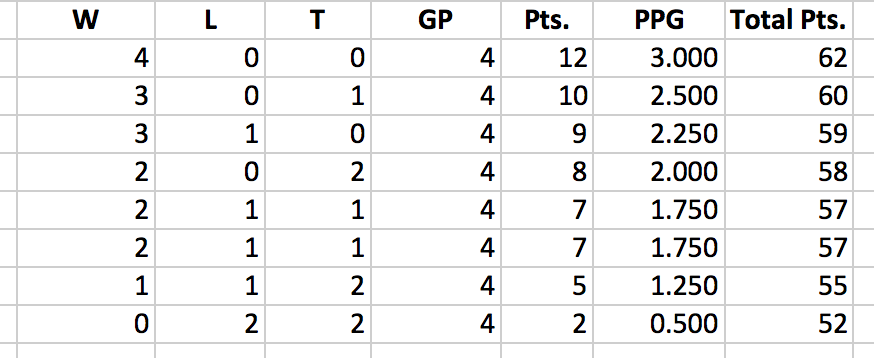
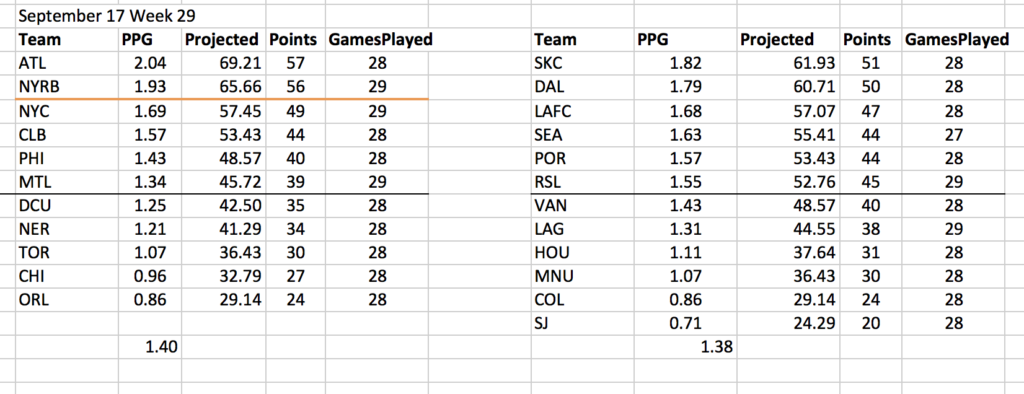
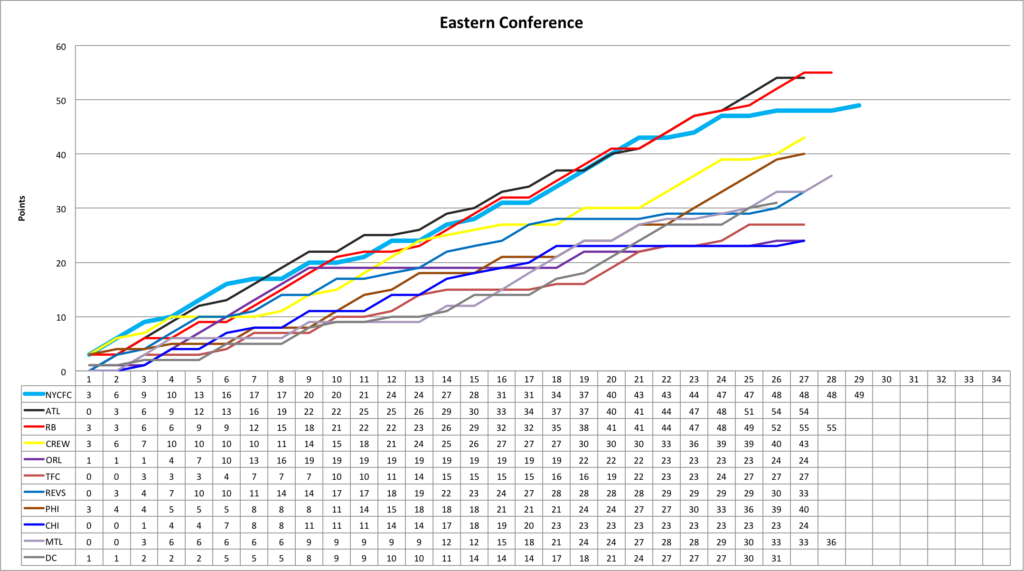
Thing is, MLS teams don’t necessarily need to have a healthy Villa-level scorer to succeed. Here are all the playoff teams:
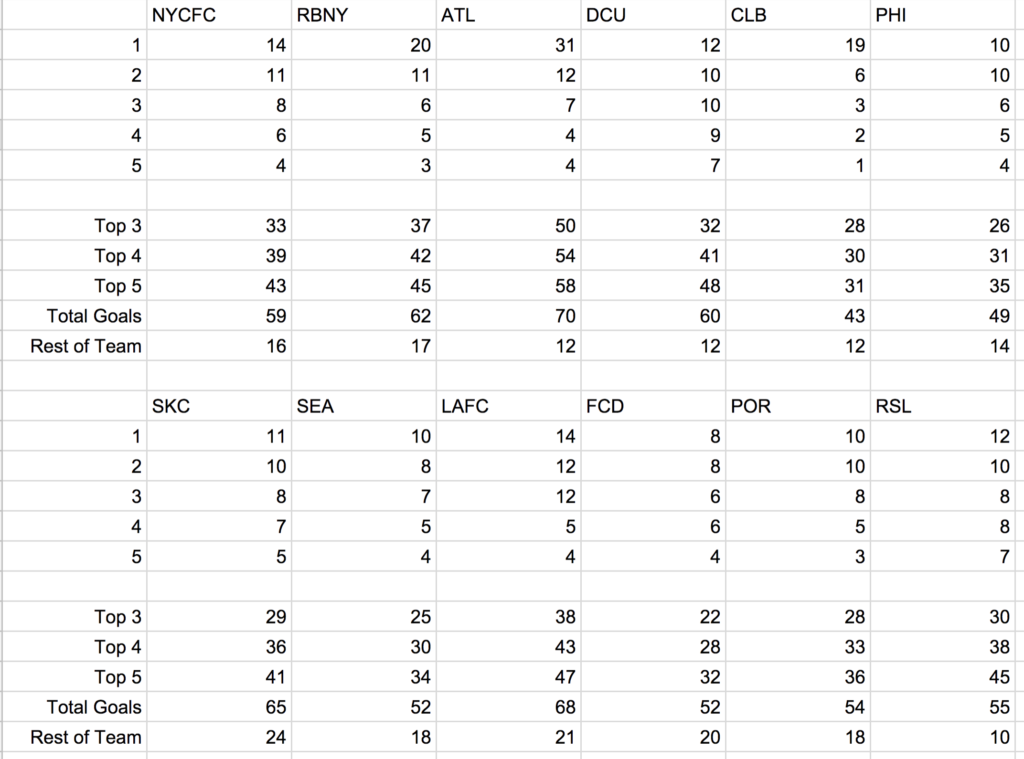
Some of these are misleading: DC and Seattle’s top scorers arrived midseason and led second half surges.  But SKC, LAFC and Dallas won more points this year than NYCFC without a better full-time scorer than an injury-limited Villa, and Portland just made it to MLS Cup without exceeding NYCFC at any of Spots 1 through 5.
Also, not our problem, but if I were in charge of SKC I would be concerned that the team might be unlikely to again get 24 goals from the Rest of Team category.  I don’t know this to be true but I expect it is something that doesn’t normally repeat year to year.
Obviously, this ignores defense, and assists, and thousands of other little things, but I do think these goal comparisons are useful.

Filed Under: NYCFC Misc

It’s All In The Framing: A Response to Dummy Run

October 31, 2018 by Mark 1 Comment

The pseudonymous Dummy Run over at Twitter  wrote the NYCFC Playoff Preview for ASA. Dummy is no dummy, and the article is great. It is also long. It is dense. It has a lot of charts. I mean, even by his standards, it is chart heavy. You will learn a lot. Go read it. Maybe twice. There is a lot of good stuff there.

But I have one big problem. Really big. The first chart in the article is a Vieira/Torrent comparison, covering many regular and advanced stats, and it shows that NYCFC is better under Torrent on basically all the advanced stats while behind on the regular ones. This is known as bad luck. This point frames his entire discussion, which covers so much more, including how NYCFC responds o pressure when it plays from the back, how it transitions into attack, and identifying specific style differences in play under Vieira and Torrent, all illustrate with graphs, charts, and video. The opening and closing theme of the piece is that Dome had the team playing better and it was bad luck that the results did not follow.

But. This is a big but. And I’m disappointed Dummy didn’t notice this, or actively chose to ignore it, but the frame he imposes — comparing all of Vieira’s games to all of Torrent’s games, masks the extreme seesaw nature of Torrent’s time at NYCFC.  As Dummy lays out in the chart I mentioned (it’s the ones with the photos of Vieira and Torrent) , Expected Goals For NYCFC went up from 1.57 to 1.73 when Dome took over, and Expected Goals Against went down from 1.32 to 1.17. So the team got better, right?  Here’s a simpler table with just those stats (some of my numbers are just slightly different because of different rounding algorithms I think):

Yay better. All good. But let’s compare these 2 coaches:

Coach 1 has results better than Torrent. Coach 2 is worse that Vieira. And — big reveal — they are both Dome Torrent, split between his his first 9 games (through the Toronto Away game) and his last 10 when the team was much worse. According to Expected Goals, the longer Torrent was in charge, the worse NYCFC played. The results were not bad luck. They matched the run of play. The only reason Dome’s results look better than Vieira’s is that before he changed things up so much, and brought in his guys, the team had it’s best xG run of the season. So the ASA article basically masks the correlation between advanced stats and results by treating Dome’s 19 games as a consistent run of play, which they were not. There was no bad luck. The team had good results for Dome when xG says they played well, and poor results when they did not. In Torrent’s first 9 games with an Expected Goal Differential of +1.08 the team went 6-2-1 for 2.11 PPG.  Then when the same differential dropped to +0.4 the team went 2-5-3 for 0.90 PPG.

The Home and Away splits show that the big difference was Away, though the team got worse at Home also.
First, Home. “Dome” is his record as a whole. “Dome1” represents his first 5 Home games, “Dome2” his last 5:

It is pretty consistent, but though the differences are small, the team actually performed better under Vieira, and the Expected Goals Against did increase by a meaningful amount in the final quarter of the season under Dome. In sum, Home defense got worse, according to Expected Goals.

Now Away. NYCFC played 9 games Away under Dome. The Dome1/2 split is First 4, last 5.

Holy crap on a stick. At first, NYCFC improved a lot on the road when Dome took over, and you may remember they won 2 Away games after a long dry spell. Arguably they should have done even better. The Expected Goal DIfferential for the 2 losses in this set of games was +0.88 (Chicago) and +0.99 (Seattle). But after that, Expected Goals For went down an entire goal per game from 1.89 to 0.90. That’s massive. At the same time, Expected Goals Against went up by 0.6 for a swing of 1.59 in Expected Goal Differential in the wrong direction between the first half of Torrent’s tenure and the second half playing Away.

What excuses are there for this? Schedule? Injuries? I cannot go with injuries because the first half of Torrent’s time coincides almost perfectly with Villa’s long absence, while the crap run overlaps with a missing Medina. That doesn’t really explain anything.

Finally, I understand that 5 and 4 game samples are really small (although that is just the H/A breakdown).  Maybe Dome had an anomalously great short run to start, then a similar bad run. Maybe next year averages out all good. But the thesis that Dome simply improved the team and the poor results do not coincide with how he had the team playing does not hold up when you break it down. When you change the framing from (1) Vieira vs Torrent to (2)Torrent’s Good Start vs Torrent’s Bad Finish you see that Dome pretty much got the results he deserved. He won when the team played well, and lost when they deteriorated. That’s true whether you go by the eye test or xG, and bad luck doesn’t really play into it. Maybe the team deserved to win a little more over the last 10, as the xGD was barely on the positive side overall. But when play objectively worsens, I’m not very sympathetic to the complaint that results should not have been quite as bad as they were. Expected goals says NYCFC certainly did not deserve a strong record at the end of the season, and any analysis of Torrent has to consider why the team did so much worse the longer he was in charge.


Filed Under: NYCFC Misc

NYCFC Playoff Seeding Status Summary

October 8, 2018 by Mark Leave a Comment

Current Position: Third 53 Points
Unable to Climb Higher
Remaining Games at DC United, Home Philadelphia Union. H/A adjusted Opponents’ PPG 1.80 (second hardest)

Teams Who Can Catch NYCFC
1. DC United
12 points back, 4 games to play.
Home Dallas, Home TFC, Home NYCFC Away Chicago. H/A adjusted Opponents’ PPG 1.11 (7th easiest-tie)
DCU has to win out, and NYCFC lose out. That will put them tied on Points and Wins. GD status currently NYC +14, DCU +6. But if NYC loses out and DC wins out, NYC will be at most +12, and DCU at least +10. So DC would have to pick up an additional 3 GD, either by winning by >1 or NYC losing by >1, and then DC leads here. Next tiebreaker is Goals For. Teams are current tied, so if DC makes up the points deficit they would win this tiebreaker, meaning they only need to pick up an additional 2 GD to win.
Bottom line: any result for NYC or dropped points for DC and NYC stays ahead. Barring that, however, tiebreakers favor DC.

2. Columbus
5 points back, 2 to play.
Away Orlando, Home Minnesota. The easiest remaining schedule in the league. H/A adjusted PPG 0.79.
The Crew have to win both to have a chance, but the schedule is ridiculously easy. If they win out and NYC gets 1 point it is a tie. Any NYC win clinches. If they draw on points they will be tied on wins. Crew GD is -2, which is 16 behind NYC, so they have to win each game by 7-9 goals to overtake NYC.
Bottom line: any result for NYC or dropped points for Columbus and NYC stays ahead, given the tiebreakers, with a minuscule chance of Columbus winning a GD tiebreaker.

3. Philadelphia
3 points back, 2 to play.
Home Red Bulls, Away NYCFC. Adjusted H/A Opponents’ PPG 1.94.
The Union need at least to match NYCFC in Week 33 and then control their destiny on Decision Day. If they fall behind by one more point it is over. If the teams finish tied on points, Philadelphia will have more wins.
Bottom line: getting more points than the Union in Week 33 is key.

Summary:
I’m just assuming Columbus beats Orlando and Minnesota. OTOH, if DC drops points in the next 2 games against Dallas and Toronto, that solves DC. But even assuming DC wins the next 2:

A win in DC guarantees that NYC finishes ahead of DC and Columbus, and no lower than 4th.
A draw in DC guarantees NYC finishes ahead of DC and no lower than 5th. If Red Bulls also beat the Union, then NYC finishes no lower than Fourth. If Orlando beats or even draws Columbus the world ends, but NYC finishes ahead of the Crew as well. Also NYC finishes ahead of CLB in GD tiebreaker barring oodles of goals by Columbus.
A Loss in DC means Decision Day is really scary, unless (1) DC first drops points to either Dallas or Toronto, and (2) Columbus drops points to Orlando.

Filed Under: 2018 Weekly Updates, NYCFC Misc

Exploring the Reasons For NYCFC’s Disappointing Second Half Under Dome Torrent

October 6, 2018 by Mark Leave a Comment

I started looking into Vieira/Torrent splits and found some interesting things. Some offer obvious conclusions, but others not so much.

All NYCFC defensive actions this season under Patrick Vieira versus Dome Torrent. pic.twitter.com/KfKHc9MCth

— Dummy Run (@thedummyrun) October 6, 2018

Click on the images in that tweet and you will see that NYCFChas been much more active on defense under Torrent. His graph does not seem to offer a H/A split, but I think it is likely most of this activity is in Away games.

At home, every number has moved in the wrong direction. Home goals per game and xGoals per game are both down (though the latter by an insignificant amount). Also at home, opponent Goals and xGoals have gone up.

Away, however, NYC goals are down but xGoals are up by a meaningful amount. Opponents goals also are down, while their xGoals are way, way lower.
Under Vieira in 2018, NYCFC gave up an average of 1.7625 xGoals per game Away, and that is down to 1.2975 under Dome. Under Vieira, road opponents never accumulated fewer that 1.4 xG per game in 8 games. Under Torrent, they only exceeded 1.4 xG twice in 8 games.

This chart also shows that in all 4 areas: Home goals for and against, and Away goals for and against, the actual goal change has been worse for Dome than the xGoal change.

I do believe that the improvements in Away xGFor and xGAgainst are big enough that it shows real improvement, especially because Torrent has discussed his emphasis on improving road form. NYCFC’s xG differential has improved by 0.801 per game on the road. I tend to give people credit when they say “my goal is to improve X” and then X improves.

Next I focused on how NYCFC has performed relative to xGoals under Vieira and Torrent. The results are not surprising given the table above, and everything we have seen and discussed the last 2 months.

First 2 lines show the difference between actual goals per game and xGoals per game. In every instance + means the team did better than expected and – means the team did worse than expected. This is where the big dispute comes in regarding whether you think performance relative to Expected Goals is mostly luck, or not. Because again in all 4 categories the team was “luckier” under Vieira than for Torrent, and for NYCFC’s Home goals scored, the difference is massive. Can bad luck be this consistent? I honestly don’t know. Logic cuts both ways. On one hand it seems unlikely that luck would point the same way in all contexts and subdivisions, unless there was a reason outside of luck. On the other hand, there is no reason why the non-lucky explanations should correspond with each other. For example, you might explain the poor results relative to xG scored as being due to a less aggressive, vertical offense in transition. But just because that is true does not suggest a substantive reason for why the club should also underperform on defense. Whether you think it is luck, or there are substantive explanations, you might expect them to be independent.

For additional context, I note that for the entire season, only 5 MLS teams are underperforming relative to xGoals at home. That’s pretty normal. In 2017 6 teams did that, in 2016 – 5, 2015 – 8, and in 2014 – 4 teams. Simply put: Most teams outperform xGoals at Home. Further, underperforming xG at home by -0.443 per game is very unusual. Since and including 2014 through 2018 to date, only 4 teams have underperformed xG by worse than -0.3 per game over an entire season. Now, Dome’s NYCFC team has done this over just 9 Home games, not a full season. Extreme and unusual results are more likely over half seasons than over full seasons. But I still think it is fair to say this result is anomalous. Being so much worse at scoring Goals at Home than accumulating xG is just wrong and unusual.

As a bit more background, it is not unusual for a team to have a wild swing in its performance relative to xG in the middle of a season. For example, here are the GD-xGD figures for 2016 NYCFC and 2017 FCD in the first 17 games compared to the last 17 games:

NYCFC 2016 GD-xGD -0.176/0.759 Swing 0.935
FC Dallas 2017 GD-xGD 0.410/-1.091 Swing 1.501

And here is the split and swing for 2018 NYCFC under PV and under DT:
NYCFC 2018 PV/DT GD-xGD 0.484/-0.478 Swing 0.962

GD-xGD combines both offense and defense, and Home and Away. Are these big swings due to luck or something else? You can explain 2016 NYCFC based on the team getting used to PV’s new system. You can explain this year with the coaching change. I confess I am less familiar with 2017 FC Dallas than either NYCFC iteration, but they had no coaching change and they had an important player, Mauro Diaz, return from injury about 40% into the season. Yet they had an enormous negative swing with no clearly obvious cause. So is it mostly luck, really? Are the NYCFC splits that seem to be based on coaching changes just a pair of big coincidences?

Also, The H/A weighted PPG of opponents facing PV was 1.42, and for Dome to date it is only 1.30. But Dome had more injuries, and a lot of odd double game weeks and rough travel.

I think the data supports enough variations in conclusions that people can argue, but I believe the following with various degrees of confidence.

I think the improved xG figures, on both offense and defense under Torrent, represent something real.
I believe the deteriorated results relative to xG is based both on luck and controllable factors.
I think Torrent has focused on Away form, and controlling possession in the midfield, and defending in the midfield.
I think the poor results relative to xGoal is based on lack of performance in the final third on both ends.
I believe NYCFC’s attack is less direct and gives teams more time to get in front of their goal.
On defense, I look at 3 of the worst games relative to xG (at Chicago, at Seattle, and at Minnesota), and can remember individual plays where an opponent broke us down and/or an NYCFC defender messed up, leading to easy goals against the run of play.
I think this combination of effects can be in sum caused by a team that is uncertain of how to play a new system, combined with a technical emphasis on midfield play.
I fully expect this to improve.
Despite a half-season under the new coach, I believe that whether this does or does not improve in time for the playoffs will mostly be luck, if only because of a super small sample size.
I strongly expect this to improve next year.
I fear it might not improve early, due to roster turnover and a guess that Dome is — believe it or not — holding back, and that next year will bring even more changes for the team to acclimate itself to.

Filed Under: NYCFC Misc

A Comparison of Two MLS Midseason Coaching Changes 2018

October 1, 2018 by Mark Leave a Comment

Both Red Bulls and NYCFC lost coaches this midseason.*
Both clubs are part of worldwide soccer organizations.
Both Red Bull GmbH and CFG have adopted a uniform playing style for all of their organizations and boast of plug’n’play interchangeability for coaches and players.
Jesse Marsch spent part of his 3.5  years at RBNY training his replacement.
Patrick Vieira spent the last 3 months of his 2.5 years at NYCFC looking for another job and took his most trusted assistants with him.
Marsch left RBNY under terms set by Red Bull GmbH.
Vieira left against the wishes of CFG.
Red Bull GmbH has a plan for all of their clubs and personnel.
CFG hired Pep Guardiola for Man City and left Vieira twisting in the wind when he saw they were working on a Pep extension.
Red Bull GmbH brought Marsch in as an assistant to their flagship club after 3.5 years at RBNY and elevated his RBNY assistant who knew that team well.
CFG let Vieira walk after 2.5 years because they had no plan for him to move forward, then hired Pep’s Man City assistant for NYCFC, who was unfamiliar with NYCFC, and has publicly expressed confusion about MLS scheduling and other quirks. He then tinkered with a team that was 15-9-8 when he arrived to the point where they have managed to earn less than a point per game over their last 11 chances.
Armas just coached a game without his two most important players (not by his choice) against the best team in the league and won 2-0.
Torrent just coached a game without his 2 most important players (by his choice) against the 16th best team in the league and lost 2-1.
RBNY earned 32 points in 16 games under Marsch, 2.00 PPG.
RBNY earned 30 points in 15 games under Armas, 2.00 PPG.
NYCFC earned 28 points in 15 games under Vieira, 1.87 PPG.
NYCFC earned 25 points in 17 games under Torrent, 1.47 PPG.

RBNY and Red Bull GmbH had a plan for RBNY. CFG/NYCFC have a plan for Man City, and afterthoughts for NYCFC. Sure, maybe Torrent and NYCFC turn it around for the playoffs. There’s no sign of that but it could happen. Even if it does, though, the CFG claims of interoperability and synergy have been revealed as a joke, and as nothing more than vacuous corporate jibber jabber.


*   I realize other teams have changed coaches during this season. But all the others (except Orlando) have come late in the year and all others, with no exception, were due to the more common situation of firing someone for basic poor performance.

Filed Under: NYCFC Misc

NYCFC Weekly Updates By The Numbers – MLS Week 31 October 1, 2018

October 1, 2018 by Mark Leave a Comment

After starting the season 5-0-2, 17 points in 7 games, NYCFC needed to get just 43 points in 27 games, or 1.5926 PPG, to reach the 60 point mark. As late as Game 21, NYC was at 2.048 PPG with a 13-4-4 record and 43 points. They needed just 17 points in 13 games or 1.3077 PPG to get 60 points. After getting only 10 points in 11 games, that is now impossible. The most NYCFC can get is 59 points, if it wins both of its remaining games. Here are all the possibilities.

In 2016, NYCFC looked like a team that overcame a slow start to build a record just short of excellent.
In 2017, NYCFC looked like a team that suffered a late season slump caused by an injury to their only reliable scorer and fell just short of excellent.
In 2018, NYCFC looks like a team that has been treading water for 3 years.

Filed Under: 2018 Weekly Updates

Interconference Play 2018 – September Results (Excluding September 1)

September 30, 2018 by Mark Leave a Comment

September (excluding September 1)
East Record 9-3-3
At Home 6-2-2 (10 games)
On Road 3-1-1 (5 games)
Goal Differential +12
East Points 30
West Points 12

Season to Date – 97 Games
East Record 53-48-24
At Home 38-16-9 (63 games)
On Road 15-32-15 (62 games)
Goal Differential +15
East Points 183
West Points 168

Dominant month by the East, building a comfortable cushion with just 8 interconference games remaining (of which 5 are at Home for the East teams). The East had the benefit of 10 Home games and only 5 Away, but the 3-1-1 Away record was impressive also.  As noted in the prior Interconference Play entry, the East will end with 3 more Home games than the West when the season is over.

Three of the East’s win’s this month were by Atlanta, who finished 7-3-2 against the West.
Red Bulls are 9-2-0 against the West, with one game remaining in San Jose.
NYCFC finished it’s Western slate of games at 6-4-2.  NYC started the season 5-1-0 against the West, and then went 1-3-2.

Filed Under: Interconference 2018

NYCFC Weekly Updates By The Numbers – MLS Week 30 September 25, 2018

September 25, 2018 by Mark Leave a Comment

Distractions

NYCFC’s PPG before the Vieira to Arsenal rumor 2.43
NYCFC’s PPG since
– the Arsenal rumor 1.43
– the Nice rumor 1.53
– Dome took over 1.47
– Eloi first took the field 0.60

This Bad Run

The projected final point total went down by 13. Last year’s slump was either 11 points and 2 wins in 9 games, or 7 points and 1 win in 7, depending on how you define when it started. The team PPG dropped in the 7 games from 1.852 to 1.676 for a 0.175 (math seems off due to rounding) reduction.
This year the slump to date is an easily identified 9-games (so far) with just 7 points and 1 win in the 9 games. The team PPG dropped in the 7 games from 2.048 to 1.667 for a 0.381 reduction.
Last year’s slump coincided with injury to Villa, the team’s only reliable goal scorer in the second half of the season. This year, the slump has a multitude of arguable causes, which both diffuses responsibility yet should be more damning.

Vieira, Torrent, and the Blame Game

NYCFC played 15 games under Viera and now has 15 under Torrent. The Viera schedule included 8 Away and 7 Home, and the Away games included SKC, Portland, LAFC, Red Bulls and Atlanta. NYC also faced Atlanta at home, which was the toughest Home matchup given Atlanta’s Away record this year. Dome’s schedule has had 8 Home and 7 Away. The toughest matchups were Away to Seattle, Columbus and Philly, none ranked higher than 4th in their conference.

NYC under Vieira lost 3 games, earned 28 points, scored 30 goals and conceded 20.
NYC under Torrent lost 5 games, earned 22 points, scored 22 goals and conceded 19.
The idea that losing Herrera had no effect on team defense but killed the team’s offense is counterintuitive at best.

You can blame it on Viera jumping ship, Dome unable to pick up on the fly, or bad luck.
You can blame it on the rain, blame it on Rio, or you can blame it on me Terry, it don’t matter to me now.
But the team scored 27% fewer goals against a much, much easier schedule since Dome took over, and won 21% fewer points.

The Company We Keep
Other teams with one win in the last 9 games, or worse.

Chicago* (one win in eleven) 20
Houston (one win in twelve) 18
New England (one win in twelve) 16
Orlando (one win in twenty) 21
Honorable Mentions
Minnesota** 17 and San Jose 23, both one win in eight games.
The other number next to each team is their place in the Supporters’ Shield standings.

* Hey, we play them this week. Maybe there’s hope.
** Hey, we play them this week, too. OTOH, six of their last 8 have been Away and we play them in Minnesota.

Playoff Seeding Update
Three point lead on Columbus; four point lead on Philadelphia. All three teams have 4 games left.
Columbus
NYC has 1 more win. If they tie on points they likely end up tied on wins as well. NYC currently has a +12 GD advantage.
Philadelphia
Teams are tied on wins. If they tie on points the Union likely ends up with more wins. NYC currently has a +15 GD advantage, FWIW.
Schedule
Home games in CAPS:
NYCFC plays CHICAGO, Minnesota, DC United, PHILADELPHIA
Columbus plays PHILADELPHIA, Montreal, Orlando, MINNESOTA
Philadelphia plays Columbus, MINNESOTA, RED BULLS, New York City

The Columbus schedule is easiest. The NYC and Philadelphia schedules are close in difficulty, with the advantage to NYC since they play each other in the Bronx (or maybe Queens). But it is best if the Union is disposed of before then. Best case scenario is if NYC can beat Chicago midweek, and Columbus beats the Union on the weekend. That’s a 7-point lead over the Union with 2 games for each before the H2H on decision day. Then, if NYC can just draw 1 of the 2 Away games, the Union would need to win both of its home games, including against the Red Bulls, to have a shot. A win and a draw for the Union in those games would leave them 4 points back going into the last game. If NYC could win one of its Away games (plus the best case scenario) then it will have clinched over the Union. Basically, any combination of NYC wins and Union losses that adds up to 3 will clinch*** 4th Place for NYC, and that almost has to start with a win over Chicago on Wednesday, and if so, it could wrap up by Saturday.
Maybe I will go Wednesday night.
*** Technically, DC, Montreal and New England have to be dealt with also, but the scenarios where any of them survive while the Union is eliminated are quite unlikely.

Apart from everything else, I really wanted 60 points this year, regardless of where the team finished. And it seemed so likely for so long.

Filed Under: 2018 Weekly Updates

NYCFC Weekly Updates By The Numbers – MLS Week 29 September 18, 2018

September 18, 2018 by Mark Leave a Comment

Short update with no NYCFC action this week.


While standing still, NYC gained a little ground looking both up and down at Red Bulls and Columbus. Catching RB would still take a Red Bull slump, while the cushion over the Crew is a bit more comfortable.Montreal’s win over the Union makes dropping to Fifth much less likely, avoiding an Away single game elimination.The Impact win also put pressure on DC, who has to win both games in hand now to stay just ahead of them.
Looking West, the LAFC tie dropped them from just above to just below NYC, and the Dallas draw with Columbus made catching them a bit easier as well. Still, passing FCD or SKC will be tough and if NYC turns itself around and makes a run to the MLS Cup final, the game might very well be in the Central Time Zone.
Finally, here is how NYCFC can clinch by beating Montreal this week.  NYC has already clinched ahead of TFC, CHI, and ORL.  If NYC wins that’s 52 points. A corresponding Montreal loss drops their max to 51.  That’s four. New England’s max is 52, but even if they get that by winning all of their remaining games, they will only have 14 wins while NYC will have 15 with the win over the Impact and total wins is the first tie-breaker. That puts NYCFC ahead of 5 teams no matter what and that is a clinch.

Filed Under: 2018 Weekly Updates

NYCFC Weekly Updates By The Numbers – MLS Week 28 September 10, 2018

September 14, 2018 by Mark Leave a Comment

NYCFC has just 6 points in its last 8 games. The last 8-game stretch as bad or worse than that was in the club’s first season, 2015, when they finished at 1.08 PG overall. For those wondering, the first 8 games of 2016 earned 7 points.
NYCFC has 33 points in its last 23 games. To find a 23-game stretch that bad you also have to go back to 2015. You can select the first 22 games of 2016 plus the last 1 of 2015, which yielded the same 33 points. If you want a 23-game run in one season, you have to go to the last 23 games of 2015, which generated 30 points.

So it is fair to say this team has had both its worst medium length run of games and worst extended run since its first season, which until now has seemed to be an aberration which never again needed to be revisited. NYCFC has never been so bad for so long since Kreis and a hideous roster forced on us by rules that were abandoned immediately afterwards.

But it is also fair to point out that the team’s best 6-game run this year came at the very beginning, which lends itself to corresponding longer runs of poor, or at least mediocre play. Historically, this team has previously always had its best run around midseason.

Best 6-games of 2015 – 13 points games 14-19
Best 6-games of 2016 – 15 points games 14-19
Best 6-games of 2017 – 13 points games 15-20
Best 6-games of 2018 – 16 points games 1-6
(A note about all such streaks- there is often some wiggle room to choose the best 6 on either side of a 3-4 game core).

I don’t think there is any reason why the best streak happened in games 1-6 this year instead of the usual time. So maybe that’s driving the perception of 2018. Yes, you can point to the coaching instability and transition, which coincidentally started with the Arsenal rumors after Game 7 as the reason for the falloff (and I have so pointed), but that also cannot be the reason why the club had its best ever 6-games just before those rumors started. The club could easily have been its regular pretty good self during those early games, instead of its best ever 6-games.

It is also interesting that the club had its best ever second-best-non-overlapping-6-game-run in 2018. Games 16-21 (right around mid-season again) earned 15 points, which is also as good or better than the first best 6-game sets of all prior seasons. The second-best-6-games in 2015-17 earned 9, 11, and 13 points in order.

One more thing: the team’s PPG in the games left after you back out the best-6 and next-best-6 is as follows:
2015 0.68
2016 1.27
2017 1.41
2018 1.06

This is a bit unfair to 2018 because it has only 17 games instead of 22 after excluding that pair of 6-game sequences. Maybe the club does get better in the last 5 games left and this improves. But for now, it is fair to say that in 2018 there has been a greater disparity between the best and worse, and more of a roller coaster effect, than any year after 2015, which is pretty much an outlier that I think most agree can be ignored for purposes of interesting comparisons.

Here are the charts. NYCFC is down to 6th in PPG, though just barely behind LAFC.

Remember when 64 points seemed a more than reasonable goal? Now it is the best that can be done.

The rolling 5-game PPG tells an ugly story.

Columbus has an opening to catch NYC. Philadelphia has an outside shot. If the Union wins both extra games – which is by no means a gimme – it is still 3 points back. The DC-Montreal-Revs race looks like it could come down to the final weekend.

Final note: NYC has the hardest remaining schedule except for Colorado. NYC’s H/A adjusted opponents’ PPG is 1.60. NYCFC’s weakest Away Game opponent is Minnesota at 1.92 PPG. They also face Montreal 2.00 PPG and DC 2.20 PPG.

Filed Under: 2018 Weekly Updates

  • 1
  • 2
  • 3
  • 4
  • Next Page »

About Page and My Other Blogs

About and the Rules

Privacy

My Photo Blog

My Dad’s Autograph Collection and Sketches

Other NYCFC Sites

11×70

The Outfield

Categories

  • 2015 Weekly Updates
  • 2016 NYCFC Assorted
  • 2016 Weekly Updates NYCFC
  • 2017 Weekly Updates NYCFC
  • 2018 Weekly Updates
  • 2019 Interconference Play
  • 2019 Weekly Updates
  • Interconference 2018
  • Interconference Play 2016
  • Interconference Play 2017
  • Methodologies
  • MLS Assorted
  • NYCFC Misc

Archives

  • November 2020
  • October 2020
  • July 2020
  • June 2020
  • October 2019
  • September 2019
  • August 2019
  • July 2019
  • June 2019
  • May 2019
  • April 2019
  • January 2019
  • November 2018
  • October 2018
  • September 2018
  • August 2018
  • July 2018
  • June 2018
  • May 2018
  • April 2018
  • March 2018
  • November 2017
  • October 2017
  • September 2017
  • August 2017
  • July 2017
  • June 2017
  • May 2017
  • April 2017
  • October 2016
  • September 2016
  • August 2016
  • July 2016
  • June 2016
  • May 2016
  • April 2016
  • March 2016
  • August 2015

Recent Posts

  • NYCFC 2020 In Review By The Numbers
  • The Best of Times, The Worst of Times
  • NYCFC 2020 – 15 Games In – 8 To Go
  • A Story About NYCFC History, My Birthday, and How I Might Be Responsible for the Pandemic
  • If Every MLS Team Were A Ride At Disney World

Recent Comments

  • visit this link on Boys Keep Swinging — NYCFC Weekly Update MLS Week 26 September 2, 2019
  • Mark on If Every MLS Team Were A Ride At Disney World
  • Michael B Parker on If Every MLS Team Were A Ride At Disney World
  • If Every MLS Team Were A Ride At Disney World on In My Beginning Is My End – NYCFC Weekly Update October 7, 2019 MLS Week 31
  • Coffee’s For Closers – NYCFC Weekly Update MLS Week 28 September 16, 2019 on Switchin’ To Glide – – NYCFC Weekly Update MLS Week 24 August 19, 2019

Meta

  • Log in
  • Entries feed
  • Comments feed
  • WordPress.org

Copyright and Disclaimers

Copyright (c) Mark Garbowski 2015-2019. All rights reserved.

I have no ads or commercial interests in connection with this blog so I need no disclaimers.

Copyright © 2022 · Agency Pro on Genesis Framework · WordPress · Log in


Loading Comments...