There have been few interconference games the last 2 weeks:
Week 7 – 1 Game
East Record 1-0-0
At Home 1-0-0
On Road 0-0-0
Goal Differential +1
East Points 3
West Points 0Week 8 – 2 Games
East Record 1-0-1
At Home 0-0-1
On Road 1-0-0
Goal Differential +2
East Points 4
West Points 1Season To Date
East Record 10-8-9
At Home 7-1-5
On Road 3-7-4
Goal Differential +6
East Points 39
West Points 33Atlanta has played 3 games against the West, all on the road, and their record is 2 Wins and 1 Draw. Their GD is +7. To be fair +5 of that was in their Week 2 game against Minnesota, when the Loons were a dumpster fire, especially on defense.
2017 MLS Interconference Play – Week 6
I’m keeping track again this year. With 22 teams the number of IC games has increased to 122, which is 11×11, plus Minnesota and Atlanta play each other twice.
Let’s catch up. As always I use the MLS W-L-T format.
Week 1 – 5 Games
East Record 0-2-3
At Home 0-1-0
On Road 0-1-3
Goal Differential -2
East Points 3
West Points 9
Week 2 – 5 Games
East Record 3-1-1
At Home 2-0-1
On Road 1-1-0
Goal Differential +6
East Points 10
West Points 4
Week 3 – 3 Games
East Record 1-2-0
At Home 0-0-0
On Road 1-2-0
Goal Differential -1
East Points 3
West Points 6
Week 4- 3 Games
East Record 2-0-1
At Home 2-0-1
On Road 0-0-0
Goal Differential +4
East Points 7
West Points 1
Week 5- 5 Games
East Record 1-1-3
At Home 1-0-1
On Road 0-1-2
Goal Differential -2
East Points 6
West Points 6
Week 6 – 3 Games
East Record 1-2-0
At Home 1-1-0
On Road 0-1-0
Goal Differential -2
East Points 3
West Points 6
Season To Date
East Record 8-8-8
At Home 6-1-4
On Road 2-7-4
Goal Differential +3
East Points 32
West Points 32
Through 24 games the conferences have exactly evenly matched records, and the West has played 2 extra home games.
Last year through 7 weeks the East was 7 games under .500 at 4-12-15 on April 19, 2016. Since then, through 103 games finishing out 2016 and starting 2017, the East is 36-34-33. Two games better than the West. To be fair the East played 3 extra games at home over those 103, but this is a record of evenly matched conferences. The East has a +7 GD over those 103 games. At what point do you think a professional soccer analyst will notice?
NYCFC 2016 Weekly Update By The Numbers – MLS Week 34 October 23 – Part 1
That was a highly entertaining way for NYCFC to end the regular season in 2016. Last week was a dispiriting loss for NYCFC, and not unexpected. That result, plus the limited and eeasily understandable scenarios for finishing this week — which were well covered in numerous places — led me to skip my weekly write-up.
Since the team’s 4-game win streak in games 16-19, the Blues have been riding a mostly alternating up and down ride based on whether the next game is Home or Away. Since Game 19, the Home record is W-W-W-D-W-W and the Away record is L-W-L-D-D-L-L-W-L. Overall since Game 19 and before yesterday they were 6-5-3 for 1.50 PPG over 14 games. They have not gone more than 2 games without a Win, or won more than 2 games in a row during that time, dating back to July 10. If it feels as if the team has been treading water for a few months, it has. But yesterday was joyous, and all the more so because the result was very much in doubt for the first 70 minutes before NYCFC exploded for 3 goals, including a sweet cherry-on-top from Villa at the death.
East/West and Home/Away
The team finished 9-8-7 and 1.42 PPG against the East compared to 6-2-2 2.0 PPG vs the West.
They finished 7-7-3 on the road which is only a disappointment because at one point they were 5-2-1 and 2.0 PPG. It is no surprise that that pace was unsustainable. As it is the team is guaranteed both the most Away wins and most Away points which is a significant accomplishment but in no ways a guarantee of future success. Last year Vancouver and Portland had the best away records and combined for 47 Away points. This year they have 21. This year NYCFC is in the position it is almost solely due to that 5-2-1 opening stretch Away. After the disastrous start at home and before the second half of being kind-of-good, that solid stretch Away made the season a success. At Home, with yesterday’s win, NYCFC ended 8-3-6 for 1.77 PPG.
Never Won Against or Lost To
With the win against the Crew yesterday, the list of MLS teams NYCFC has never won against is down to Dallas, RSL and SKC (pending expansion next year). All are in the West and NYCFC has played each only twice.
Meanwhile, there are 4 West Conference teams who still have never won a game against NYCFC: Colorado, Houston, San Jose, and Vancouver. More impressive, or at least quirky, NYCFC has also never lost to Toronto through 5 games, with a record of 2 Wins and 3 Draws against TFC. That’s something to keep in mind for a likely first playoff opponent, although I would not bank anything on it continuing just because it has up until now.
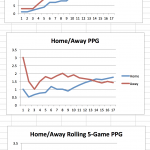
Home/Away Charts
These are new.
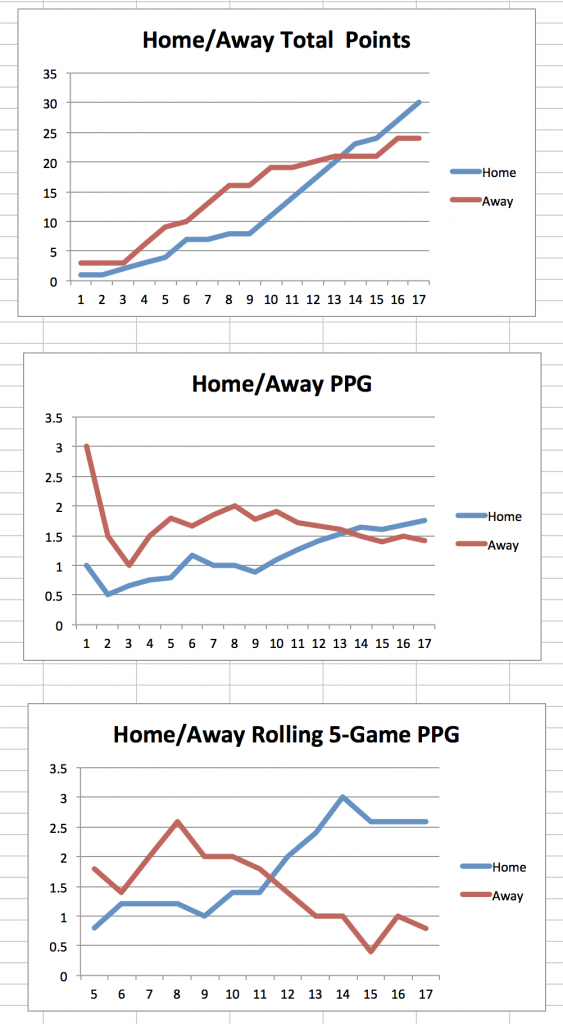
The top 2 both show that NYCFC maintained a better Away record than home through the first 2/3 of the season with Home finally crossing ahead of Away only around the 14 game mark. Note of course that these charts present the data as if the Home and Away games were happening simultaneously, or at least evenly, which they were not. The 5-game rolling average shows the lines crossing a bit earlier as they are not burdened by the full history. It also better demonstrates how the team’s fortune at Home and Away completely turned around in the second half.
More to come wrapping up the season. I’ve decided not to do a single omnibus wrap-up post but will spread some details and hopefully some insights throughout the week.
NYCFC 2016 Weekly Update By The Numbers – MLS Week 30 October 2 UPDATED With Full Weekend Results
One East Conference game remains this weekend, but it has a limited effect on the NYCFC possibilities so why wait. I will add a brief update when the Orlando | Montreal game ends.
What We Definitely Know
With two games to go many things are becoming certain or at least clear, while others are just as muddled as ever. Let’s start with what we know:
- NYC is not only guaranteed a home playoff game (which requires finishing no lower than 4th place), they cannot finish below third place in the East. The 4th Place DCU trail NYC by 8 points and also have 2 games left. The 6th Place Impact have 3 games remaining and trail by 10 points. Neither can catch NYC.
- The race for 1st place in the East is down to 3 teams. The Red Bulls have the inside track, being tied with NYC and owning the second-level Goal Differential tie-breaker by 10 goals. Toronto has wasted its opportunities and now needs to climb over both NY teams to regain First Place.
Top Of The East Scenarios
Next, let’s move on to the easy to understand scenarios. That also involves winning the East, or at least finishing second and getting a first round playoff bye. Rather than explore all 2-game scenarios, let’s focus on where we will stand based on the next set of games in two weeks.
- We’ll begin by looking down. NYC leads TFC by 2 points.
- If NYC wins and Toronto loses or ties, NYC clinches second place. Even with a TFC tie NYC will lead by 4 points with one game to go.
- If NYC wins and TFC wins (or both tie or both lose), NYC can achieve at least second place if in the final games
- NYC wins, no matter what TFC does
- NYC ties and TFC ties or loses, or
- both NYC and TFC lose
- But if NYC ties or loses its final game, and TFC win in its last game, they will be tied and TFC will own the Goal Differential tie breaker.
- Now let’s punch up. Both NY teams are tied by the Red Bulls, as noted, own the tie-breaker:
- If next round NYC win and RB lose or tie, OR if NYC ties and RB lose:
- Then in the next week NYC finishes first if NYC win no matter what RB does
- Or if NYC draws and RB lose in the last week
- If next round both teams win, or tie, or lose:
- The NYC finishes ahead of RB of they get more points in the last game than RB
- If next round draws and RB win
- Then in the final week NYC can finish ahead if it wins and RB lose
- If next round NYC loses and RB wins
- Then RB has effectively guaranteed finishing ahead of NYC based on the GD tie-breaker, barring a 10+ goal differential turnaround in the last week.
- If next round NYC win and RB lose or tie, OR if NYC ties and RB lose:
The scenarios between the Red Bulls and Toronto are the same as between TFC and NYC, except the GD is closer, but the Red Bulls still have the edge.
Supporters Shield
NYCFC’s chances are all but mathematically done. They trail Dallas by 5 points with 2 games to play, and are tied with Colorado who has 4 games to play. Plus there is the tie with the Red Bulls.
CONCACAF Champions League
- NYC gets a spot if it wins the East.
- AFter that it gets very complicated. Another spot becomes available if Dallas win Supporters Shield or MLS Cup. Two spots become available if Dallas wins both. If TFC finishes first in the East, now seemingly unlikely, another spot opens up because TFC can only qualify under different rules for the Canadian CCL spots. Those potentially available spots go to the top US teams in the Supporters Shield race who have not already qualified. So if the Red Bulls or (less likely) TFC finish first in the East, NYC needs to finish as high as possible to try to snag one of those possible spots. Colorado has a big edge with those 2 extra games, but also has some tough travel and some short rest. But I still give Colorado the edge to finish ahead of NYC. The clearest and I think easiest path to CCL is winning the East (or the MLS Cup, of course!).
What Has Happened To TFC At Home?
As of Sunday August 6 Toronto had a 4-game winning streak, and faced 4 of its next 5 on the road followed by 5 of its last 6 at home. TFC went 3-1-1 in the next 5 and seemed on track to have a smooth path to winning the East. Oddly, the only loss came in the only home game in that set. Since then in 4-straight home games TFC is winless with one loss and 3 draws. Giovinco has missed the last 5 straight games, and that could explain the entire slide by itself, but it also seems TFC has gone off form in more ways than his absence could explain.
The Remaining Schedule for NYRB, NYC, and TFC
All 3 have one home and one away.
Red Bulls have Columbus at Home and Philadelphia Away.
TFC has Montreal Away and Chicago at Home.
NYC has DCU Away and Columbus at Home.
The following are not predictions but statements of probability based on form and my judgment, for whatever that is worth.
The Red Bulls should beat Columbus at Home but lose or draw in Philadelphia.
TFC’s tougher game is against the Impact. Beating Chicago at Home should be near automatic.
NYC has beaten DCU twice this year, but DC has just won 3 straight and since Patrick Mullins joined them they have lost only 2 times in 13 games. The first was his first appearance in which he did not start. The second loss was in NYC. Beating DC in DC with their current form will be tough. Finishing at home against Columbus should be easy, but the Crew remain the only East Conference team never to lose to NYC. I almost believe NYC will win out, but neither game is a good matchup for NYC.
What Is To Be Done
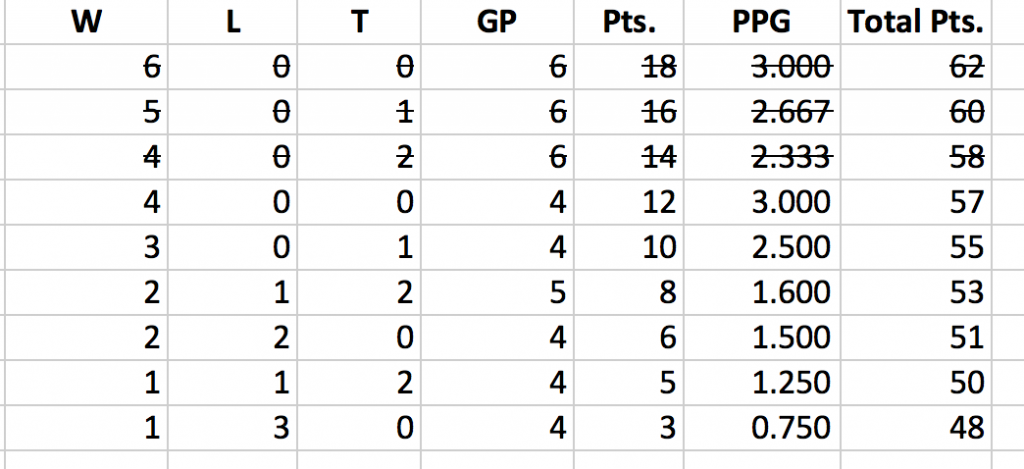
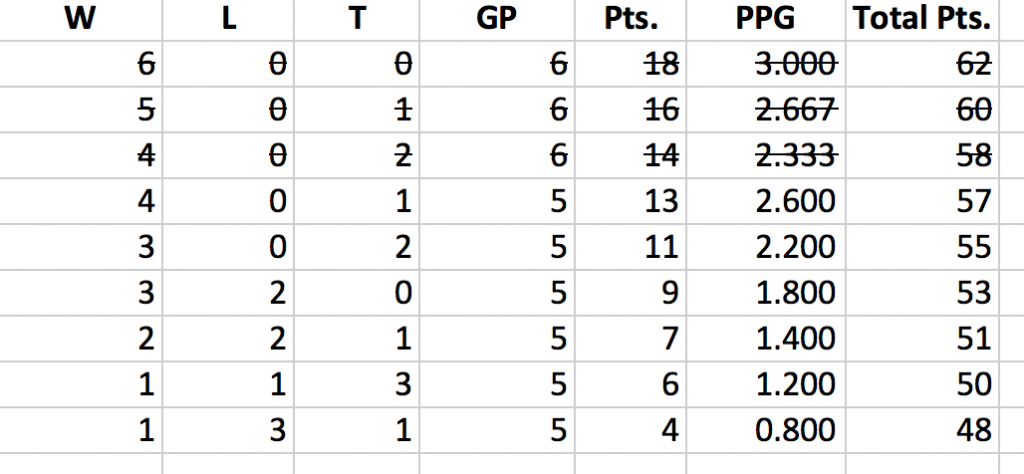
With 2 games remaining it is easy to figure out:
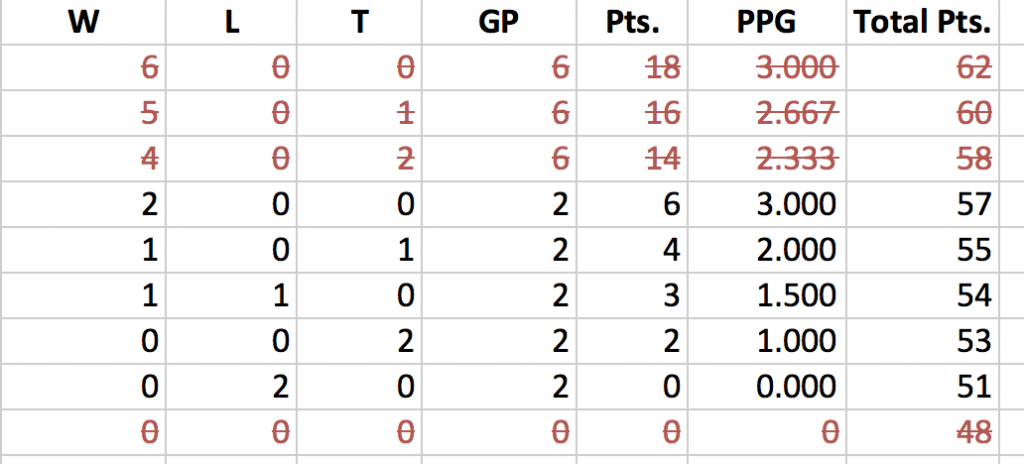
The only missing possibility in the chart is a 52 point finish with one loss and one draw.
UPDATE: Montreal’s win moves them up to 4th Place and drops Philadelphia to 6th, who sit on 42 points. Just last week the projected 6th place finish was 42 and now that’s the base with 2 games to go. I am starting to wonder if the playoff line always jumps a few points at the very end of the season.
Supporters Shield and CCL Chart
RSL drops off the list and is replaced by Seattle, who are mathematically out of the SS race and don’t have any real chance at CCL but deserve some recognition for their turnaround. The only team with a real chabnce of catching Dallas is Colorado, and it will take a lot for that to happen. Colorado has to win their two extra games and keep pace with whatever Dallas does Dallas in the other two to pull ahead. Colorado plays in the only game next weekend and plays midweek the following week to finally catch up on games played.
A Dallas win of the SS will free up one CCL slot and Colorado seems best positioned to take that. The Rapids are even with both NY teams on points and have 2 extra games to play. That’s not automatic but it is theirs to win or lose. Even if you assume they lose the game that have to play on 2-days rest they still have a chance to get 9 points while NYC and RB can get at most 6. Then, whether or not an additional spot opens up for the CCL, NYCFC’s best path is to overtake NYRB, who currently sit ahead on the tie-breaker, and are very unlikely to lose that advantage.
2016 MLS Interconference Play – Round 31 Week 30
Everything in the Interconference Play posts is presented from an East Conference point of view. E.G., a Home game means the East team is Home.
Interconference play is done for the year.
This week four games, 2 home and 2 away.
East Record 3-1-0
Season To Date
East Record 32-38-30
At Home 24-9-17 (50 games)
On Road 8-29-13 (50 games)
Goal Differential -7
East Points 126
West Points 144
Despite perceptions, the West is not much better than the East.
Over 100 games, the West outscored the East by 7 goals. That’s less than one extra goal per team and 0.07 goals per game..
Over 100 games, the West won 6 more games than the East. That’s less than one extra win per team.
The West is better, but not by much. Those 6 wins count as 18 points, which seems to expand their influence, but it is still only 6 wins. I’ll update this again when the season ends but as of when I write this the West has played 8 fewer ties than the East. That gives the West an additional 8 points in its standings that do not reflect actual superiority. How much better is the West? 6 wins spread among 10 teams in 100 games. That’s the amount the West is better. Last year the West won 11 more games than the East.
Some final notes:
- Both conferences won fewer IC games due to the additional ties they played with each other. For the same reason, together the West and the East gained fewer points from interconference play than last year in the same number of games , but the East still improved its PPG by closing the gap against the West. Last year the West won 1.57 PPG in IC games; this year they earned 1.44 PPG. Last year the East won 1.24 PPG in IC play. This year the East earned 1.26.
- NYCFC was 6-2-2 for 2.0 PPG against the West. The East excluding NYCFC was only 26-36-28 for 1.18 PPG. Last year NYCFC was 2-6-2 against the West for 0.80 PPG. Arguably the entire improvement of the East against the West this year is attributable to NYCFC.
- As of all games through Sunday August 7, the West had 10 more wins than the East with 81 IC games played. Since then the East went 9-5-5 in the final 19 IC games for 1.68 PPG.
NYCFC 2016 Weekly Update By The Numbers – MLS Week 29 Sept 25
The playoffs are a certainty. NYC beat Chicago and the other dominoes fell properly this week so NYCFC has clinched a playoff spot, as did Toronto and the Red Bulls, all at the same time when the Red Bulls beat Montreal. I do not find myself particularly excited by this. I think the reason is that it has been a near certainty for 2-3 months, and a true (if not mathematical) certainty for 2-3 weeks. Also the specific result that put the Bluebirds over the top was a bad result for the team in all other respects. NYCCF is in a battle with the Red Bulls for Second Place in the conference and a first round playoff bye. The Pigeons really need the Red Bulls to drop points. That this RB win happened to clinch a playoff spot for NYCFC, which I considered a given anyway, was not even bittersweet. I just wanted NYRB to lose. Finally, with the other results this weekend NYC would have clinched once Columbus beat New England in the last game of the week Sunday night. With all that, I haven’t lost sight of how great it is the team is doing well and comfortably made the playoffs in its second year.
Apart from that Red Bull win it was overall it was a good weekend of results for NYCFC. The problem is that the most immediate concern is the Red Bulls and second place. Every other team we are trying to catch dropped points but they still seem hard to reach.
The Red Bulls and NYCFC won and everyone else dropped points. The Galaxy lost, and every other team drew. NYCFC is likely to lose the tie-breakers to everyone but LAG, so has to finish ahead on points to finish ahead. As this chart shows, even if NYCFC wins out its remaining 3 games, they need Dalls to drop 6 points, Colorado 7, and Toronto 4. The team that’s in reach and has the most immediate reward is the Red Bulls. Also, it is unclear if finishing ahead of the West Conference teams will have any helpful results. A spot in the CONCACAF Champions League is — maybe — up for grabs but there are so many movings parts to that calculus it seems too remote. NYC needs to win and get help, or it will likely finish third in the conference, and my disappointment with that prospect is clearly of the moment. pre-season I would have taken it gladly. It also seemed wildly optimistic on June 3, when the team had just lost at home to RSL, the Home record was 1-3-5, and the PPG overall PPG was 1.20. By the way, I feel much more optimistic than this post is coming out.
Some basics:
v East: 8-7-7 1.41 PPG
v West: 5-2-2 1.89 PPG
—————————-
Home: 7-3-6 1.69 PPG
Away 6-6-3 1.4 PPG
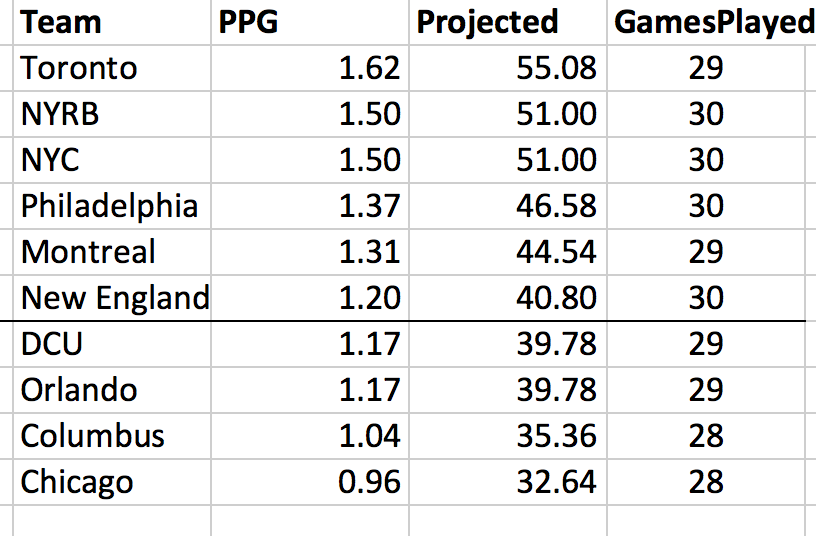
The what needs to be done chart can start losing possibilities at the bottom with every new point:
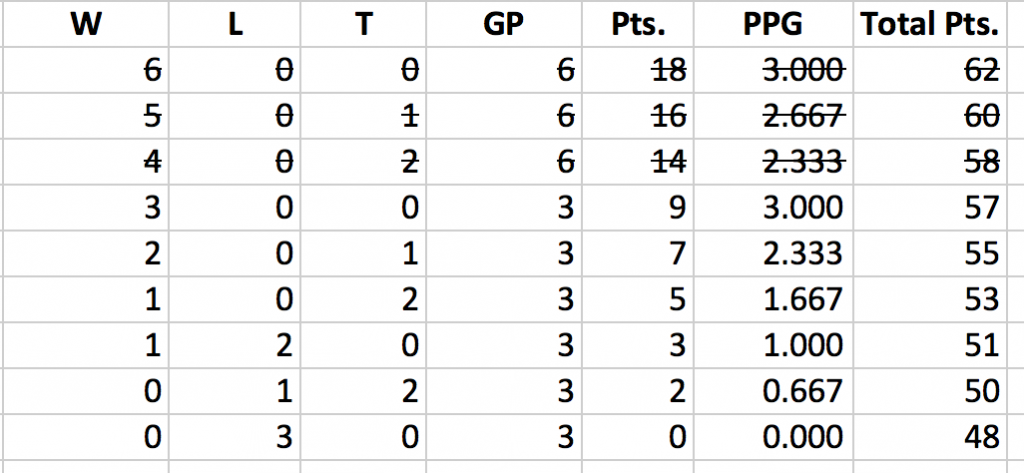
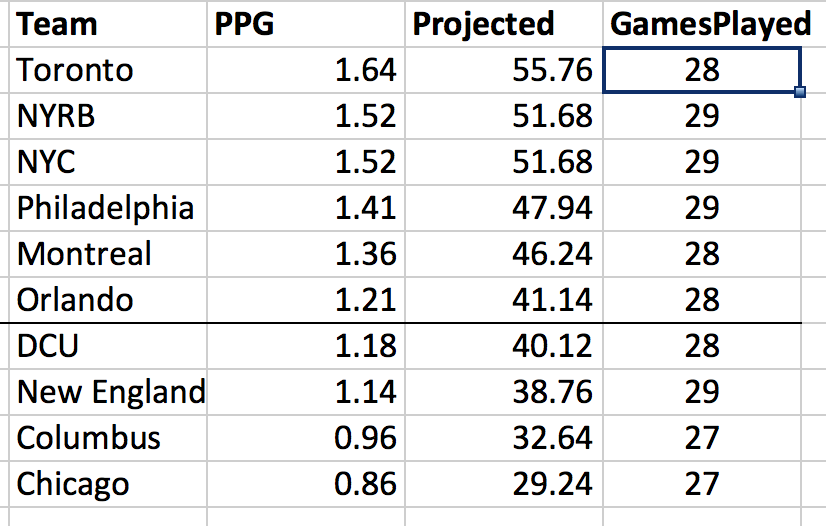
This chart is officially meaningless to NYCFC but goes up for reference anyway. DC United is dragging the playoff line up just a bit.
DC United is dragging the playoff line up just a bit. They have lost only once in their last 10 games, over which their PPG is 1.50 compared to 1.10 the rest of the season. They are the only one of NYCFC’s remaining opponents over the playoff line at the moment. But, the other two are also playing their best ball of the season, unfortunately. The Dynamo, who host NYCFC this coming Friday, are at 1.40 PPG in the last 10 compared to 0.95 before that, and Columbus is also 1.40 over the last 10 compared to a truly dismal 0.83 before that.
NYC has two road games left and has not won Away since July 17 at Montreal. NYC’s only remaining home game is against Columbus which is the only East Conference team NYCFC has never beaten. IF NYCFC finishes strong some negative streaks will end.
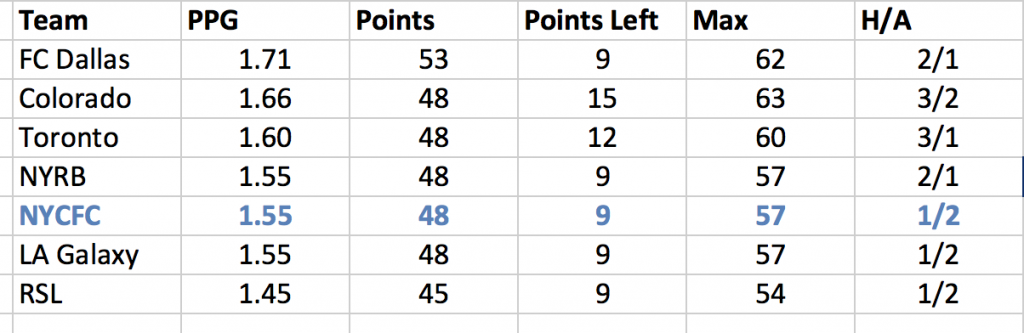
Montreal’s maximum point number is 50. DCU sits at 49. NYCFC have 48 points today. One NYCFC win, or Impact or DCU loss, and NYCFC clinches finishing at least in Fourth Place and a home playoff game in the first round of the playoffs.
NYCFC 2016 Weekly Update By The Numbers – MLS Week 28 Sept 18
Four games left in the MLS regular season for NYCFC, and fans of the team are hoping it can turn things around. Yet they’re not really doing poorly. They’re just not doing as well as we hoped they would. The BlueBirds’ high point was after Game 19, which saw them win game 4 of a 4-game win streak. The PPG at that point was 1.58 for the year, and after a terrible start, saw them go 7-2-2 over the next 11 for 2.09 PPG over that period. Over the most recent 11 games they are 4-3-3 for 1.36 PPG. That is a drop, but it’s not terrible. It’s 0.01 worse than what Philadelphia — sitting right behind them in the standings — has done all year. It qualifies for the playoffs in both conferences. But it is obviously a big falloff from that high. NYCFC fans convinced themselves — I think — that the team was better than it was, that the early start was a combination of new players, a new system, and bad luck, and that the 11-game run after that was the new reality. But sports is often a series of streaks that can have no particular relationship to cause and effect. NYCFC had a bad start, a great mid-season run, and is now playing in between those two poles. At the end of the day you are what your record says you are, and right now NYCFC is a third place team. That doesn’t mean they will not rise or fall in the next four games. They still have a chance to make a run higher, or drop further.
NYC is tied with NYRB on points, but sits in third while the Red Bulls are in second because of the second tie-breaker which is Goal Differential. The Red Bulls lead that by 13 points. The Red Bull Wedding is not by itself the difference makes at the moment. If the Red Bulls won that game 1-0 their GD would be 6 and NYCFC would be at 5, so NYRB would still be ahead. But NYCFC would be in striking distance so it still has a significant impact. NYCFC has to finish ahead of the Red Bulls on points to finish ahead of them. It does not help that NYRB has 3 of its last 4 games at home where the team won 10 of 14 tries this year. NYCFC will probably need to win at Home and Away to finish ahead of them.
Playoff Clinching Update: Dallas FC became the first team to clinch a playoff spot this weekend. By my calculations NYC can do so this weekend. A win alone will ensure NYC finishes ahead of Chicago and Columbus. DC and Orlando play each other, and NYC clinches over the loser, or clinches over both if it is a tie. So a tie does the deal and has NYC finishing ahead of 4 teams for a playoff clinch. Similarly, a New England tie or loss to Columbus has NYC clinching ahead of New England.
Teams NYCFC has never beaten:
- Columbus
- SKC
- RSL
- Dallas
Three West Conference teams that NYCFC has only played twice, and Columbus. NYC is 0-2-2 0.50 PPG against Columbus. NYCFC hosts Columbus on the last day of the season. Columbus had 3 wins in its first 22 games this year (one of those against NYCFC) and now has 3 in its last 6. Great.
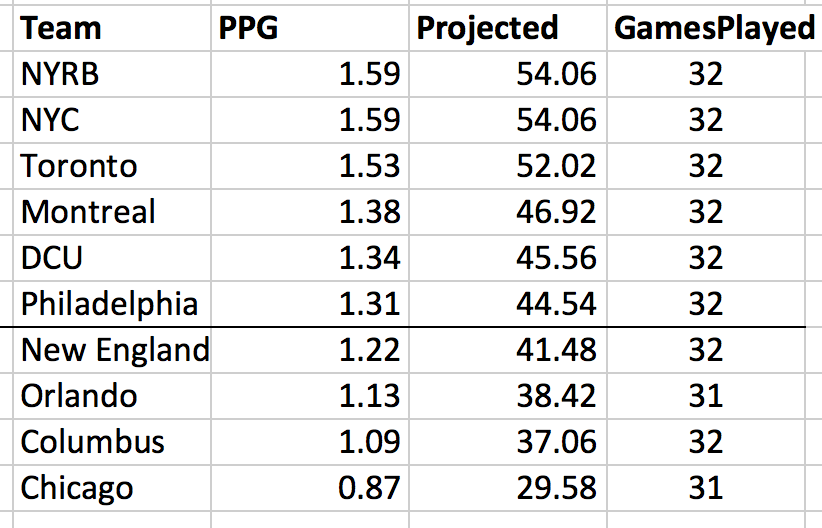
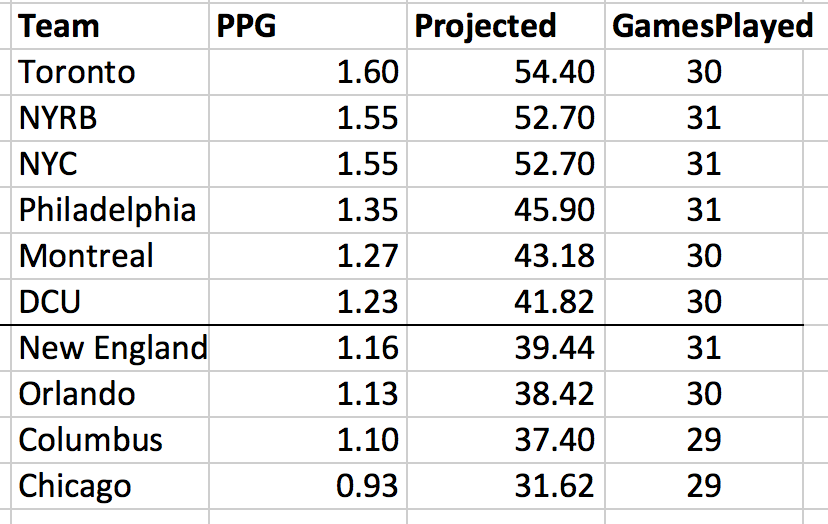
The East Conference Playoff line is holding down at 40-41 points.
The what-we-need-to-do chart did not lose any possibilities this week, but it will take 4 wins to keep 57 a possibility.
Splits:
Home Record 6-3-6 1.60 PPG
Away Record 6-6-3 1.40 PPG
East Record 7-7-7- 1.33 PPG
West Record 5-2-2 1.89 PPG
Charts Keep Rollin’
Finally, thanks to commenter FootyLovin for the following. Here is a chart comparing the 5-game rolling PPG average for NYCFC for 2015 and 2015. He thought of it, inspired by my 4-game block chart. I did switch to 5-game rolling because I think it’s a better measure than 4 games. I only used 4-game blocks to have more data points in the other chart.
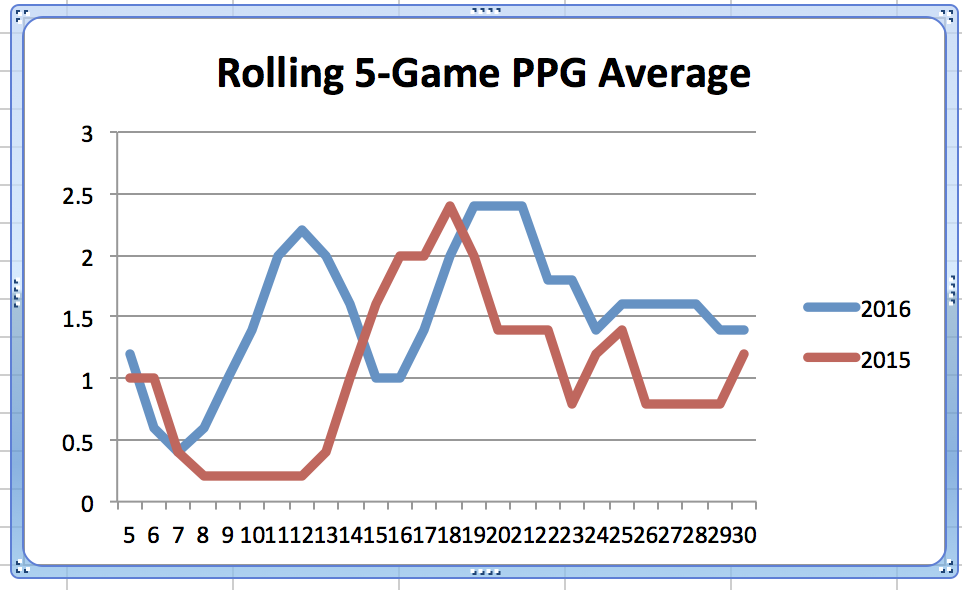
Just wow at the similarities. The team is clearly better, but the season path has so many points of equivalence.
NYCFC 2016 | 2015 Comparison
With 4 games to go I decided to pull out the NYCFC 2015 vs. 2016 charts again, and I decided to add one new chart.
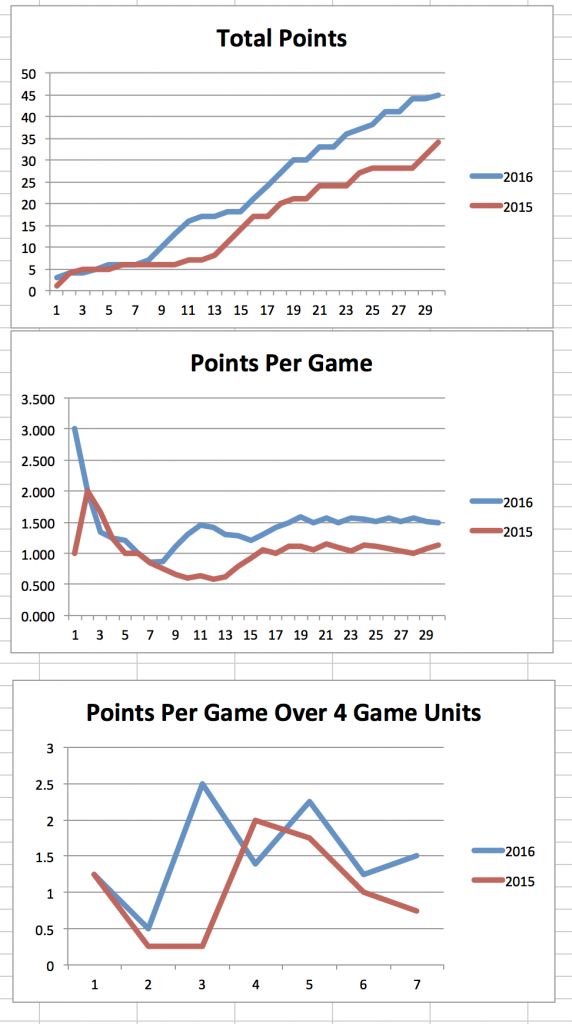
I’ve posted the top 2 charts a few times before. They each have flaws, but together I think they provide enough information to draw some conclusions. The problem of the first chart is that the lines only go up or stay flat. Over the course of a season every team will seem to progress, with the differences being a matter of scale and speed. The issue with the second chart is that every new game has a lesser effect on the chart than the games before it did (when they were each the latest game). After game 3 each game including the latest is worth 33.3% of the total. After game 30 each game is worth 3.3%. So you will usually see progressions like the ones above where there are some big moves early then the lines flatten out unless there are big streaks like winning or losing 4 out of 5 or so.
Despite those limitations, you can tell that NYCFC’s 2 seasons started out the same, with an extended slump, but that they broke out of it sooner in 2016. You can also tell that in 2016 NYCFC has had 2 stretches of above-average play that have largely driven most of its success this season. You can also see that the 2015 team had one stretch from games 14-18 that was responsible for the best part of that year.
But the new chart really shows all this better. I split the season into mostly 4 game blocks. Because 34 is divisible only by 17 and 2, it’s impossible to do that exactly so the split is theee 4-game blocks, followed by a 5-game set. That’s 17 games and half the season, so repeat it to round it out. We are through 7 of the 8 blocks, and this chart makes everything I described above even more clear. Both the 2015 and 2016 teams started poorly. 2016 pulled out sooner and more sharply. 2015 NYCFC had one stellar stretch at the end of the first half of the season followed by a long, painful decline, while the 2016 team had 2 very good blocks in which it averaged more than 2 PPG. Since then NYCFC 2016 has been muddling through the remainder of the season at about its average rate of success. The last block is five games and will probably determine whether the team is viewed as limping to the playoffs or going in hot.
2016 MLS Interconference Play – Round 29 Week 28
Everything in the Interconference Play posts is presented from an East Conference point of view. E.G., a Home game means the East team is Home.
This week two games, 1 home and 1 away.
East Record 0-1-1
Season To Date
East Record 29-37-30
At Home 22-9-17 (48 games)
On Road 7-28-13 (48 games)
Goal Differential -12
East Points 117
West Points 141
It seems the biggest difference between the East and West in head-to-head play is that the West wins twice as many home games as it draws (28-13), while the East wins a few more home games than it draws (22-17). The West loses less at home as well, but only by 2 games (9/7). The real difference makes is that the West gets 3 points playing the East at home and the East gets only 1 point at home too many times.
There are only 4 interconference games remaining this season.
2016 Weekly Update – September 13 MLS Week 27
I present your Third Place New York City Football Club. Ugh.
What a bad week of results. The only real positive was that DC United pulled back a tie after being down 2-0 to the Red Bulls. Thanks to that NYC is tied with RB and not 2 points behind. The Philadelphia/Montreal tie was good, but neither team seems much of a threat. Toronto’s win in Chicago ends TFC’s “tough”schedule stretch in which they had to play 4 of 5 on the road before finishing with 5 of 6 at home. Before that 4 0f 5 stretch started I wrote“If TFC gets just 7 or 8 points in their next 5 tough games they are in very good shape even if NYC gets 18-20 more points overall.TFC is very likely to get 12 points in their last 6, with 5 of them at home against weak road teams. So 8 + 12 would mean 20 points in their last 11 and 56 total. NYC needs to go 6-2-2 to beat that. That’s doable, but I’d feel a lot better if TFC gets say, 5 or 6 points in the next 5 games. ”
Well, TFC got 10 points in those 5 games, oddly winning 3 of the 4 Away and losing at Home. In that same period NYC earned only 7 points in 5 games. Now TFC sites 2 points up plus a game in hand. First place seems extremely unlikely. But who knows. Maybe TFC collapses at home. I would not count on it but this season is very unpredictable so it would not be a shock either.
The larger concern is being tied with the Red Bulls with 5 games to go. We both have 3 Home Games and 2 Away. At this point we are both strong at Home and weak Away. We could easily finish tied. The first tiebreaker is Number of Wins. We are currently even and with 5 games to go it is likely that if we finish tied the two teams will still be tied on Wins. Yes, NYC could go 3-2-0 while RB goes 2-0-3 but more likely we stay tied on Wins. Then the nest tiebreaker is Goal Differential. Here, there is no hope. RB has a +12 GD and NYC sits at -1. The odds of that changing while the teams remain tied on Points and Wins is effectively zero. Even if NYC gets 5 wins and RB gets 5 losses it is not so very likely to change. The point being that NYC needs to finish ahead of RB on points to finish ahead of RB, to finish second, and to get the first-round playoff bye. Barring a convenient NY-RB collapse, NYC will need to resume winning on the road.
NYC’s poor Away form means the team has not had even a solid 2-game streak of good results since winning 4 in a row in a streak that straddled June and July. In the 10 games since then the best “streak” for NYC was 2 draws in a row as the results have been L-W-L-W-D-D-W-L-W-L. Whether NYC can change its road results back to positive will likely determine where it finishes. Getting either 4 or 6 points in the final 2 Away games would be huge. Even getting 3 could be a difference maker.
The East Conference PPG Playoff line is still pointing in the low 40s, with no indication it will move anywhere near last year’s line of 49.
Even if Orlando goes on a streak, Montreal seems stuck in a mid-40s range and is drifting lower right now, so that is probably a ceiling on this year’s line.
Finally, and sadly, I had to cross out 3 possibilities at the top of the What-We-Need-To-Do chart.
It is impossible to get 62, 60,, or 58 points. A record of 5-0-0 would get 59, not shown on the chart. That is the team’s maximum right now.
UPDATE: I forgot to add the following earlier.
With the loss to NE Revs, NYC’s record against the East drops to a very mediocre 7-7-7 for 1.33 PPG. Against the West the Blue Birds are 5-2-1 and 2.0 PPG.
The Home Record is 6-3-5 1.64 PPG and the Away record drops to 6-6-3 1.40 PPG.
Finally, the loss also means limited headway on the playoff clinching front. A win would have guaranteed that NYC finishes ahead of the Revs. Instead it still takes a minimum of two games of perfect results to clinch over the Revs, as well as Chicago and Columbus. It will take at least 3 good game results to do the same for DCU or Orlando.
- « Previous Page
- 1
- …
- 11
- 12
- 13
- 14
- 15
- …
- 19
- Next Page »