City Blues By The Numbers

You are here: Home / 2016 NYCFC Assorted / NYCFC 2016 | 2015 Comparison

NYCFC 2016 | 2015 Comparison

September 18, 2016 by Mark 2 Comments

With 4 games to go I decided to pull out the NYCFC 2015 vs. 2016 charts again, and I decided to add one new chart.

screen-shot-2016-09-18-at-9-08-58-am

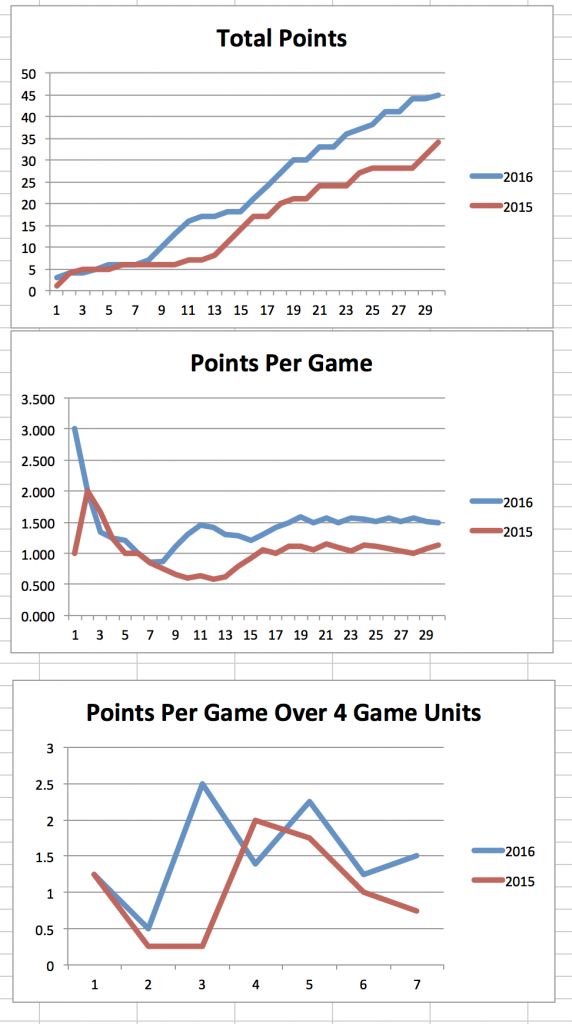
I’ve posted the top 2 charts a few times before. They each have flaws, but together I think they provide enough information to draw some conclusions.  The problem of the first chart is that the lines only go up or stay flat. Over the course of a season every team will seem to progress, with the differences being a matter of scale and speed. The issue with the second chart is that every new game has a lesser effect on the chart than the games before it did (when they were each the latest game). After game 3 each game including the latest is worth 33.3% of the total. After game 30 each game is worth 3.3%. So you will usually see progressions like the ones above where there are some big moves early then   the lines flatten out unless there are big streaks like winning or losing 4 out of 5 or so.

Despite those limitations, you can tell that NYCFC’s 2 seasons started out the same, with an extended slump, but that they broke out of it sooner in 2016. You can also tell that in 2016 NYCFC has had 2 stretches of above-average play that have largely driven most of its success this season. You can also see that the 2015 team had one stretch from games 14-18 that was responsible for the best part of that year.

But the new chart really shows all this better. I split the season into mostly 4 game blocks. Because 34 is divisible only by 17 and 2, it’s impossible to do that exactly so the split is theee 4-game blocks, followed by a 5-game set. That’s 17 games and half the season, so repeat it to round it out. We are through 7 of the 8 blocks, and this chart makes everything I described above even more clear.  Both the 2015 and 2016 teams started poorly. 2016 pulled out sooner and more sharply. 2015 NYCFC had one stellar stretch at the end of the first half of the season followed by a long, painful decline, while  the 2016 team had 2 very good blocks in which it averaged more than 2 PPG. Since then NYCFC 2016 has been muddling through the remainder of the season at about its average rate of success.  The last block is five games and will probably determine whether the team is viewed as limping to the playoffs or going in hot.


Filed Under: 2016 NYCFC Assorted

Comments

  1. footylovin says

    September 18, 2016 at 6:20 pm

    Really like the 4 game unit chart. At first glance I thought it was a running 4 game ppg. I actually think that might provide a useful (and maybe better) alternative. You wouldn’t have to break the season into artificial 4 game blocks. Wouldn’t have any 5 gamers. And you could more specifically see the ups and downs. I think.

    Either way, love the addition of your new chart.

    Reply
    • Mark says

      September 18, 2016 at 7:56 pm

      That’s a good idea. Thanks for sharing. I’ll try to put it together in the next week.

      Reply

Leave a Reply Cancel reply

Your email address will not be published. Required fields are marked *

This site uses Akismet to reduce spam. Learn how your comment data is processed.

About Page and My Other Blogs

About and the Rules

Privacy

My Photo Blog

My Dad’s Autograph Collection and Sketches

Other NYCFC Sites

NYCFC Forums

The Outfield

Categories

  • 2015 Weekly Updates
  • 2016 NYCFC Assorted
  • 2016 Weekly Updates NYCFC
  • 2017 Weekly Updates NYCFC
  • 2018 Weekly Updates
  • 2019 Interconference Play
  • 2019 Weekly Updates
  • Interconference 2018
  • Interconference Play 2016
  • Interconference Play 2017
  • Methodologies
  • MLS Assorted
  • NYCFC Misc

Archives

  • September 2022
  • May 2022
  • November 2020
  • October 2020
  • July 2020
  • June 2020
  • October 2019
  • September 2019
  • August 2019
  • July 2019
  • June 2019
  • May 2019
  • April 2019
  • January 2019
  • November 2018
  • October 2018
  • September 2018
  • August 2018
  • July 2018
  • June 2018
  • May 2018
  • April 2018
  • March 2018
  • November 2017
  • October 2017
  • September 2017
  • August 2017
  • July 2017
  • June 2017
  • May 2017
  • April 2017
  • October 2016
  • September 2016
  • August 2016
  • July 2016
  • June 2016
  • May 2016
  • April 2016
  • March 2016
  • August 2015

Recent Posts

  • Goal Differential Minus xGoal Differential – Spoiler: It’s About Cushing
  • NYCFC May 30, 2022 – Odds’n’Ends, Shapes and Contrasts
  • NYCFC 2020 In Review By The Numbers
  • The Best of Times, The Worst of Times
  • NYCFC 2020 – 15 Games In – 8 To Go

Recent Comments

  • JC on NYCFC May 30, 2022 – Odds’n’Ends, Shapes and Contrasts
  • visit this link on Boys Keep Swinging — NYCFC Weekly Update MLS Week 26 September 2, 2019
  • Mark on If Every MLS Team Were A Ride At Disney World
  • Michael B Parker on If Every MLS Team Were A Ride At Disney World
  • If Every MLS Team Were A Ride At Disney World on In My Beginning Is My End – NYCFC Weekly Update October 7, 2019 MLS Week 31

Meta

  • Log in
  • Entries feed
  • Comments feed
  • WordPress.org

Copyright and Disclaimers

Copyright (c) Mark Garbowski 2015-2019. All rights reserved.

I have no ads or commercial interests in connection with this blog so I need no disclaimers.

Copyright © 2023 · Agency Pro on Genesis Framework · WordPress · Log in