City Blues By The Numbers

You are here: Home / 2016 / Archives for June 2016

Archives for June 2016

NYCFC Weekly Update June 26, 2016 – Cup Half Full Edition

June 26, 2016 by Mark 1 Comment

  1. Cup Half Full

    • We’re halfway through with 24 points and so the easy math says we project to 48. We’re also in second place and the playoff line sits at roughly 43 making our cushion nearly 5 points.
    • This was a very good week for us. We also jumped from Fifth to Second in the PPG standings (I believe that is the highest all year), and no longer does every team in the conference have games in hand on us (although most do).
    • Philadelphia might be slipping.
    • The Red Bulls cannot win on the road (except Yankee Stadium).
    • Our road record continues to impress (1.86 PPG) as does our record against the seemingly superior West (2.25 PPG).
    • Our overall PPG of 1.41 is a shade short of 0.3 better than anything we reached last year excluding thru the first 3 games.
    • We played most of the first half without a certain pair of English midfielders who make us demonstrably better. Barring more injuries, we should expect to be a better team in the second half than we were in the first.
    • As bad as our home record was, it just seems unlikely we can continue to drop as many late points at home as we did in the first half of the season.

    Cup Half Empty

    • We have 10 road games left and no matter how good a road team we are it is tough to maintain road excellence. We might do it, but don’t discount the difficulty.
    • We also have 2 games left against the Red Bulls. I don’t believe we’re doomed to lose to them always but I also hate betting against a trend.
    • I expect 3 of the teams below the playoff line: Toronto, New England and Columbus, to make solid runs in the second half and improve. Toronto especially because they have 12 home games remaining and they’re not weird about H/A ratios like we are.

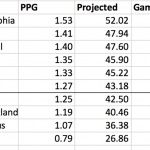
    I could add more here and there, but on balance I’m currently in a Glass Half Full mood as the bullets suggest. The next 5 games will be huge as we play Red Bulls twice and 4 of the 5 are on the road. We either prove our Road Warrior record is real or not. Here are the PPG standings:

    92e470fa-abf8-472d-9479-cac8f10f9586

    How Tough Is Our Road?
    The previously mentioned the next 4 are not so bad considering. The Red Bulls have 6 home wins and 4 wins over losses but New England, SKC and Montreal are a combined 4 wins over losses total at home. Those 3 are road points looking to be grabbed. We are also lucky to get the Rapids in NY this year as they are 7 wins over losses at home to date. But, one item of worry is that our last 6 road games are among our hardest. As those teams have a combined 14 more wins than losses at home. I would really like to keep building our road record in the next 4 because the rest of the schedule is notably more difficult.

    What Do We Need to Do?
    Probably another 6 or 7 wins:

    3ab6667b-908f-4ebd-ab68-fd1ddfcdf5a1

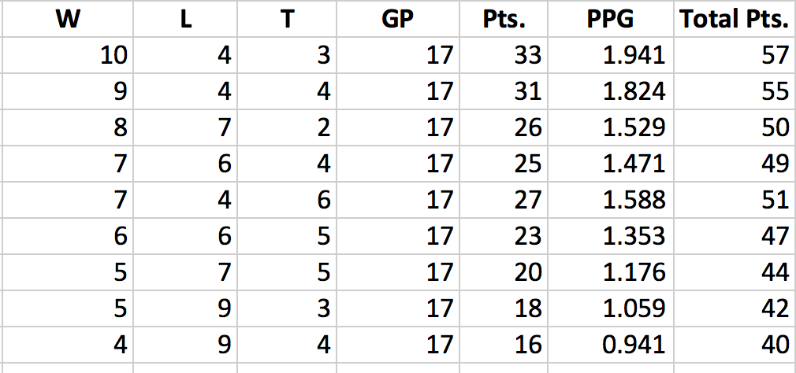
    I prefer to hope we can manage 4 wins in our remaining 7 homes games, then squeeze out another 3 out of 10 on the road. Last year Vancouver and Portland tied for the league lead with 7 road wins. To match that would be a significant accomplishment. To exceed it would be outstanding., and likely guarantee a playoff spot.


Filed Under: 2016 Weekly Updates NYCFC

NYCFC Has Not Conceded 23 Set Piece Goals

June 16, 2016 by Mark Leave a Comment

  1. I Think The 23 Set piece Goals in 26 Home Games Stat Is Very Wrong

    HRB has this stat and doesn’t provide a source, and but the RSL announcers mentioned the 23 set-piece concessions at home stat (without adding how many games) during the condensed match. They said it right after the Burrito goal off a free kick. So they are probably the original source for this.
    I went back and reviewed the summary and sometimes highlights of every game.
    I count 12 set-pieces conceded last year, with 6 at home. This counts the SKC throw-in as a set-piece.
    I count 8 this year, all at home. That adds up to 20 total, and 14 at home. If you want to be strict and exclude the throw-in it is 19 and 13.
    It’s possible I missed one, or maybe even 2-3, but there’s no way I missed 9 home set-piece concessions. Plus I think I’m right.
    We have in fact played 26 home games, so the stat has that going for it.
    Here they are with the game number, date, H/A, Type, scorer, and minute
    2015
    1 3/8/2015 Orlando Away Free Kick kaka 91
    4 3/28/2015 SKC Home throw-in Opara 13
    11 5/15/2015 Chicago Home free kick Cocis header 14
    13 5/30/2015 Houston Home corner kick Bruin header 16
    14 6/6/2015 Philadelphia Away corner kick Sapong 46
    17 6/28/2015 NJRB Home free kick Duvall 52
    Home free kick Miazga 73
    26 8/23/2015 Galaxy Away free kick (quick kick) Zardes 36
    28 9/12/2015 Dallas Away corner kick Michel 45+
    31 9/26/2015 Vancouver Away corner kick Amarikwa 72
    32 10/2/2015 DC Away free kick Saborio 90+
    34 10/25/2015 New England Home corner kick Rowe 55
    2016
    2 3/13/2016 Toronto Home free kick Perquis 45+
    4 3/26/2016 New England Home free kick Tierney 38
    8 4/27/2016 Montreal Home free kick Oduro 90
    13 5/21/2016 NJRB Home corner McCarty 3
    Home corner McCarty 51
    Home free kick Veron 83
    Home corner Baah 89
    15 6/2/2016 RSL Home free kick Burrito 67

    That’s still terrible but I guess qualifies as slightly positive news. I also note that both times we conceded more than once in a game has been to our favorite local energy drink team.
    Also, 6 of them were at 45 to 45+ or 90 to 90+. That’s killer.

    UPDATE: It probably is people counting PKs to make up the difference, but if so that’s a case of letting definitions confuse things. Nobody cares how well a team “defends” penalty kicks. Nobody defends penalty kicks well, and it’s a fundamentally different animal than corners and free kicks, even though they all start with a dead ball.


Filed Under: 2016 NYCFC Assorted

Reasons To Be Cheerful – Playoff Line Edition

June 13, 2016 by Mark Leave a Comment

  1. Reasons To Be Cheerful
    As noted before, the playoff line jumped up quite a bit at the end of last season.
    I tried to figure out what happened and found that it was at least in part a result of things that I think are unlikely to repeat. But let’s start with the slightly not-so-good news.
    Interconference Games
    The East usually loses points when it plays the West and this suppresses the playoff line for the East. The MLS schedule lowers the number of interconference games in the last 2 months of the season. Last year there were 15 IC games in September and October, representing 15 of IC games during the last 20.5% of the season. This year there are only 11 IC games in the same period. This would actually cause the playoff line to go up compared to last year if form holds, but I’m not too concerned about that because f the next factor.
    Interconference Results
    Last year the West outperformed the East earning 142 points in IC games to only 97 in the East during March through August. Then, for some reason, the East went on a tear winning 27 points the last 2 months compared to 15 for the West. That, I’m sure, did more to raise the playoff line in the East than the simple number of IC games. I’ve no idea why this happened, and no reason to expect it will repeat itself. It could of course, but there seems to be no reason to predict it will. If that is in fact the case, expect the line not to rise so much late in the season.
    Frequency of Ties
    Last year there was an extremely low number of ties in the last quarter of the season. A game that ends with one team winning creates 3 points. A tie only creates 2. So ties lower the total number of points in the league and thereby lower the total number of points needed to make the playoffs. So I checked.
    I divided the season into 4 quarters of 9-8-8-9 games, and then counted how many ties came in each quarter league wide. Ideally I would do this for East Conference games alone but that was too hard and I think this is a good enough proxy. Last year only 16.7% of the total ties for the year took place in the 4th quarter of the league schedule. That’s the lowest percentage for any quarter in the last 5 years. I found no trend that the 4th quarter tends to have the lowest number of ties. I did OTOH notice that in 4 of the last 5 years the second half of the season had an unusually-seeming number of ties: 43%, 55%, 46%, 42%, 35%. The average in those 5 years was that 44% of ties came in the second half of each season.
    But then I went back to the previous 5 years and that trend disappeared and the second half tie percentages are 52%, 50%, 57%, 43%, and 51%, which yields a nice 50% average. Basically there is no pattern, but if you look for an anomaly the 4th quarter of 2015 had the third lowest percentage in MLS in the last 10 years. That is unlikely to repeat this year. Again, it could happen, but I see no reason to predict it. This would mean that again, the playoff line should not increase so much at the end of the season the way it did last year.
    Specifically in the East, here is how each team just stopped generating tie games at the end of the season in 2015:
    Chicago last draw August 29
    Columbus last draw August 19
    DC One draw after June
    Montreal no ties in last 8 games
    New England 1 draw after July
    RB last draw August 5
    NYC last draw August 19
    Orlando one draw after August 8
    Philadelphia one draw in last 9 games
    Toronto no draws after July

    The chances of this happening again are beyond my ability to calculate but it seems really unlikely. I do think the final playoff line will be higher than where it is right now, but I think it will be a few points lower than last year.


Filed Under: MLS Assorted

About Page and My Other Blogs

About and the Rules

Privacy

My Photo Blog

My Dad’s Autograph Collection and Sketches

Other NYCFC Sites

NYCFC Forums

The Outfield

Categories

  • 2015 Weekly Updates
  • 2016 NYCFC Assorted
  • 2016 Weekly Updates NYCFC
  • 2017 Weekly Updates NYCFC
  • 2018 Weekly Updates
  • 2019 Interconference Play
  • 2019 Weekly Updates
  • Interconference 2018
  • Interconference Play 2016
  • Interconference Play 2017
  • Methodologies
  • MLS Assorted
  • NYCFC Misc

Archives

  • September 2022
  • May 2022
  • November 2020
  • October 2020
  • July 2020
  • June 2020
  • October 2019
  • September 2019
  • August 2019
  • July 2019
  • June 2019
  • May 2019
  • April 2019
  • January 2019
  • November 2018
  • October 2018
  • September 2018
  • August 2018
  • July 2018
  • June 2018
  • May 2018
  • April 2018
  • March 2018
  • November 2017
  • October 2017
  • September 2017
  • August 2017
  • July 2017
  • June 2017
  • May 2017
  • April 2017
  • October 2016
  • September 2016
  • August 2016
  • July 2016
  • June 2016
  • May 2016
  • April 2016
  • March 2016
  • August 2015

Recent Posts

  • Goal Differential Minus xGoal Differential – Spoiler: It’s About Cushing
  • NYCFC May 30, 2022 – Odds’n’Ends, Shapes and Contrasts
  • NYCFC 2020 In Review By The Numbers
  • The Best of Times, The Worst of Times
  • NYCFC 2020 – 15 Games In – 8 To Go

Recent Comments

  • JC on NYCFC May 30, 2022 – Odds’n’Ends, Shapes and Contrasts
  • visit this link on Boys Keep Swinging — NYCFC Weekly Update MLS Week 26 September 2, 2019
  • Mark on If Every MLS Team Were A Ride At Disney World
  • Michael B Parker on If Every MLS Team Were A Ride At Disney World
  • If Every MLS Team Were A Ride At Disney World on In My Beginning Is My End – NYCFC Weekly Update October 7, 2019 MLS Week 31

Meta

  • Log in
  • Entries feed
  • Comments feed
  • WordPress.org

Copyright and Disclaimers

Copyright (c) Mark Garbowski 2015-2019. All rights reserved.

I have no ads or commercial interests in connection with this blog so I need no disclaimers.

Copyright © 2023 · Agency Pro on Genesis Framework · WordPress · Log in