City Blues By The Numbers

You are here: Home / 2017 / Archives for May 2017

Archives for May 2017

NYCFC 2017 Weekly Update By The Numbers – MLS Week 13 May 30

May 31, 2017 by Mark Leave a Comment

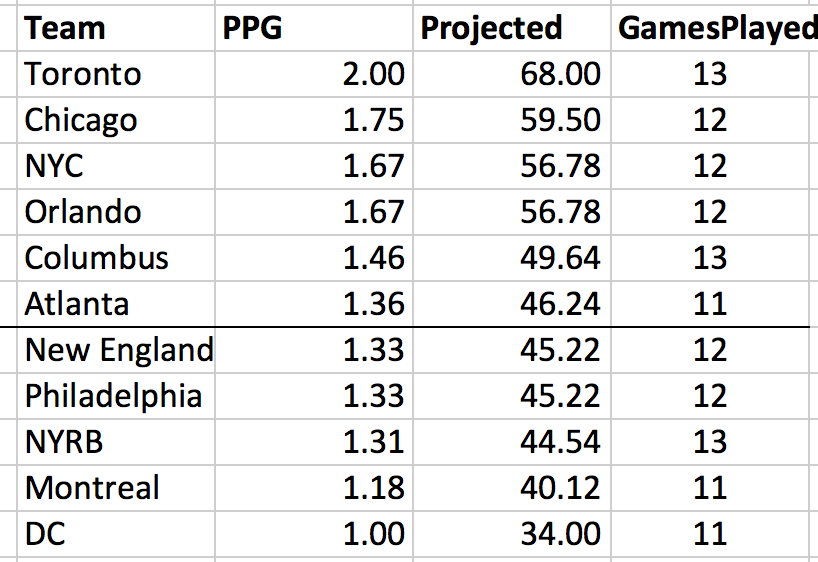
The good news is the Blues are third in the conference and fourth overall while playing an Away-heavy schedule of only 5 at home and 8 on the road.The semi-bad news is more than a third of the league is within a one game swing of overtaking the Bluebirds so that position is precarious. The PPG standings also place them in 3rd in the East and drop them to 5th overall.

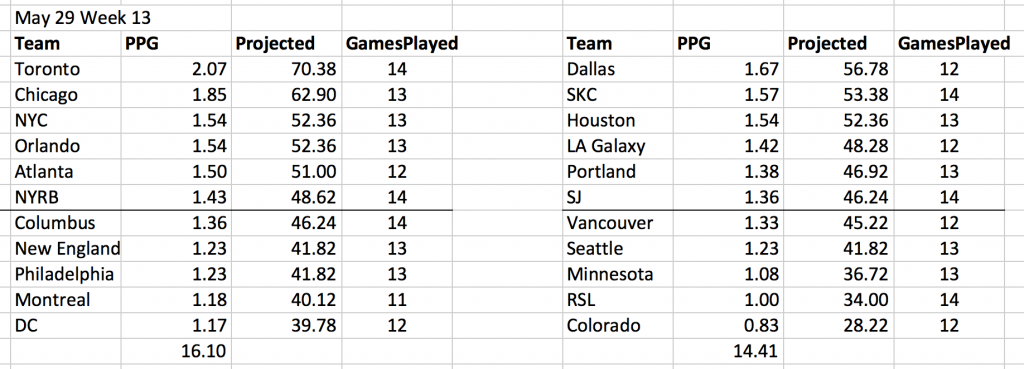
Also, the Celestes really need to pick it up at home. They have dropped 5 points at home in only 5 games, which is not particularly good for a team that high in the standings. The two teams ahead of the Pigeons have dropped a combined 6 points in 14 Home games. Gotham City could win 9 straight at home and will have built a Home record 1 point better than TFC and the Fire have combined for so far. If the goal is to make the playoffs, the current Home pace of 2.0 PPG is fine. But a challenge for top of the East will require improvement. Here are the possible results.

Looked at another way, the Blue Hawks have 5 losses in their first 13 games. If they are going to end up in the neighborhood of 60 points, they can probably lose at most another 5 in the final 21 games. They could easily lose 4-5 of their remaining 9 Away games. They might do better, but that would hardly be a surprise. Las Palomas lost 5 of their last 9 Away games last year (after the first 8 Away games last year they had only 2 losses compared to 4 this year). Which means, switching back to the Home perspective, the club might need to go undefeated the rest of the way or lose at most one more to improve on last year and be reasonably certain of avoiding the initial one-game playoff round.

I do not see this team as designed to excel in the playoffs. I see this team being built to excel on an overall everything-being-equal basis. By that I mean that the philosophy seems to be to play in a consistent way that creates more chances for you and less for the opponent, and over a full season that will mean success. But there seems to be no plan to win any specific game when things go awry, Down, 3-0, the Pigeons play the same way they do up 2-0. There is no apparent strategy to play with more urgency when a game starts going the wrong way. I fully understand that manufacturing goals at will is an iffy proposition at best, but when this team either plays poorly, or plays well and suffers a bit of bad luck, it seems to be done for. Winning a set of 3-4 playoff match-ups in a row with that foundation seems to be wishful thinking, and avoiding at least one of those playoff rounds would likely increase the odds of success considerably. Last year 54 points did that, but current indications, while admittedly still early, are that finishing top 2 in the East could require more.

It needs to start now, with 6 of the next 8 at Home, the last 2 of which are against the teams the Blues are chasing — Chicago and Toronto.

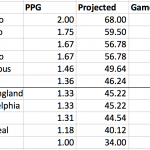
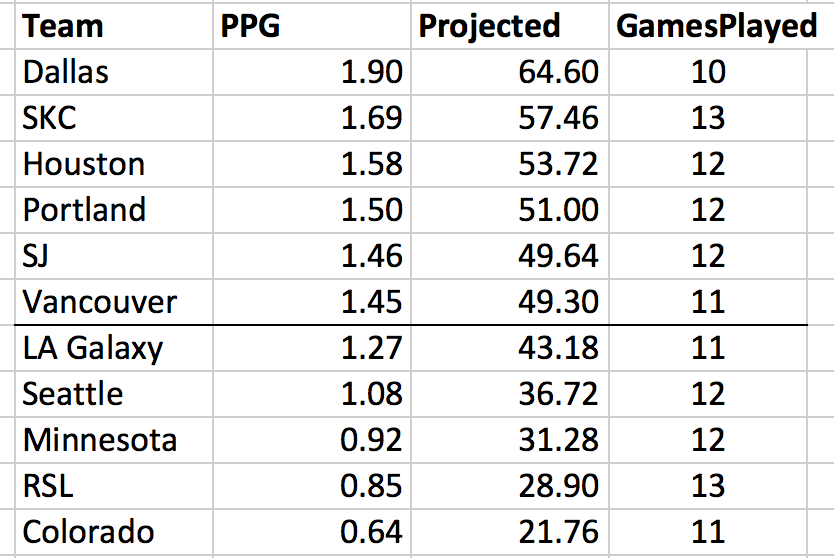
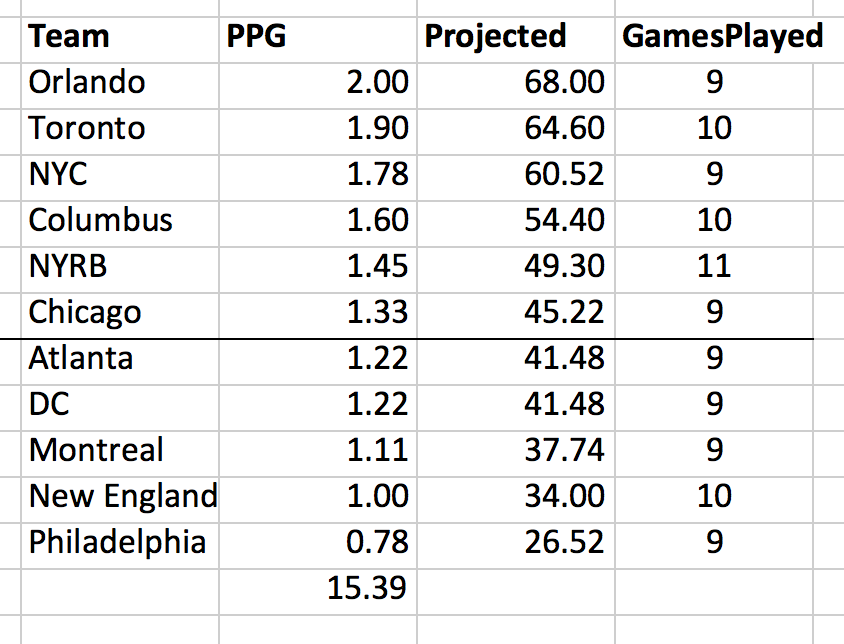
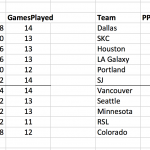
I think it is worth considering where NYC finishes in relation to the top West teams. This is not so much for Shield purposes as for a potential MLS Cup Home Field advantage. This is why I’ve added the West PPG standings to the posts this year. The number at the bottom of those charts is the average PPG of each conference.

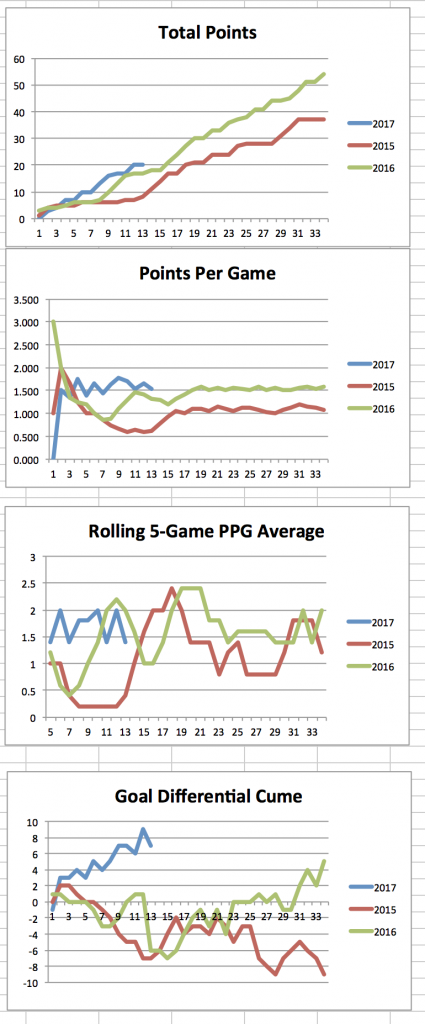
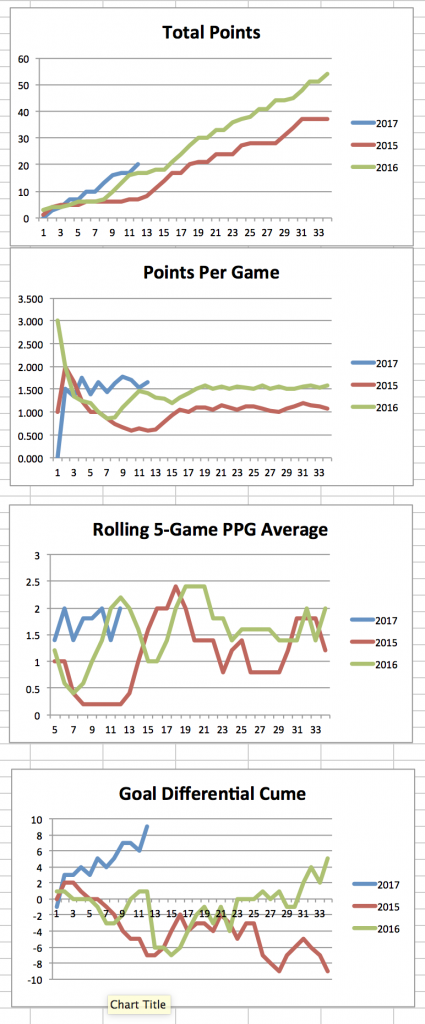
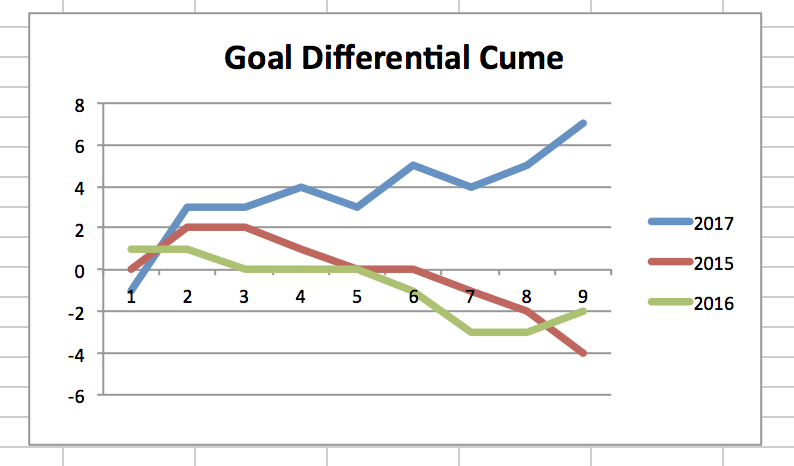
Finally, here are the year-to-year graph comparisons.

Filed Under: 2017 Weekly Updates NYCFC

2017 MLS Interconference Play – Week 13

May 28, 2017 by Mark Leave a Comment

Week 13 – 4 Games
East Record 2-2-0
At Home 1-0-0
On Road 1-2-0
Goal Differential +0
East Points 6
West Points 6

Season To Date
East Record 23-15-16
At Home 18-3-6 (27)
On Road 5-12-10 (27)
Goal Differential +21
East Points 85
West Points 61

Another solid week for the East, splitting 4 games of which 3 were Away. Once again the East took care of business at Home as Chicago beat Dallas, but the West managed only 6 of a potential 9 points at home. That might not be bad except the East got 15 of 15 potential home points last week. The East has a 24 point advantage while sitting even on Home games played.

I admit I am surprised at how quickly the public consensus has changed about the relative strengths of the two conferences. Just about everyone agrees the East has shown itself to be stronger this year.

Filed Under: Interconference Play 2017

NYCFC 2017 Weekly Update By The Numbers – MLS Week 12 May 23

May 28, 2017 by Mark Leave a Comment

It’s been two weeks since the last update.* I didn’t do one last week because drawing on the road against Dallas told us very little, and it seemed more appropriate to treat the Dallas-RSL-Orlando road swing in 8 days as one set even though they were part of separate MLS weeks. But with a bad loss and a great win, we are still in a very similar spot.
NYC’s PPG dropped from 1.78 to 1.67. Four points from 9 on the road is acceptable but not good.

* Also this was written last Tuesday but only posted barely in time to beat NYC’s Week 13 game against Atlanta.


Let’s look at the West table for comparison.


There is only one spot on these tables where the West is better than the east and it is the projected final playoff spot where Vancouver projects to 49 and Atlanta to 46. Probably a quirk and barring a change in inter conference play form the playoff line in the East should be higher than the West.
The bottom teams in the East are showing much better quality than their West counterparts.

Inefficiencies
NYC leads the league in Goal Differential per game. NYC is one of 3 teams to be giving up less than one goal per game (Dallas and SKC are the others). NYC has never given up more than 2 goals in a game. Oddly, however, NYC has only 3 clean sheets. For comparison, Philadelphia has allowed 2 more goals in total with but has 5 clean sheets. NYS is second for goals scored. Atlanta is first with game in hand. NYC is tied for actual total GD with Toronto.

Yet the points do not reflect this apparent dominance. Here’s how:

NYC’s GD in its 3 shutouts is +9, leaving a total GD of 0 in the remaining 9 games. that is not efficient at all. Even considering the 0 GD, a record of 3-4-2 is not particularly fortunate.
NYC has only gave up 2 goals 4 times. And has only scored 1 goal itself 4 times. Three of those four separate instances overlapped for a 2-1 loss. The others were 3-2 win over Columbus and 1-1 draw with Montreal. The only other single goal win was 2-1 over San Jose.

There is no reason to expect this trend to continue, but in a season with only 32 games, there is no reason to expect it to right itself either. But if the team is going to finish at or near the top of the East, it will have to improve.

Mikey and the Cards

Mikey Lopez’s reputation as a yellow card machine is well warranted. He had 6 yellow cards last year in only 672 minutes. His one yellow per every 113 minute pace was highest among players with more than 200 minutes or more than 2 cards.

But he had no straight reds, and he never got two yellows in one game. He got his fifth yellow on May 21 during RBW, then only got one more yellow all year, on July 17 against Montreal. After that 7 appearances, no starts, 110 minutes. Three of his six yellows came in the first half of a game he started and played 78, 90 and 90 minutes an dhe manages not to get a second.

He also never had a red while playing for SKC, about 960 minutes. He has no red cards in his MLS career. So his other reputation as a red card waiting to happen only works in the sense, that, yes, eventually one can expect any streak to end. But his record is not that of a red card magnet. If he plays substantial minutes and does not drop his pace he will, however, see 1 or more suspensions this year for accumulation.

Possession
Average possession in NYC’s 6 wins, 56.0%
Average possession in the 4 losses, 63.7%
Draws 58.4%.

Make of that what you will.

Charts


The divergence between this year’s Goal Differential compared to last year, and other metrics compared to last year, is considerable. If you are disappointed that the results do not seem to match the team’s improvement that is why.

What if:

Here are some projected results based on possible finishes over the remaining 22 games, regardless of likelihood.
13-5-4 63
11-6-5 58
10-7-5 55
9-7-6 53
8-8-6 50
7-8-7 48
8-12-2 46
7-13-2 43
6-14-2 40

Really I think the team needs to improve at home. 3-1-1 is fine but not what is needed to finish with an elite record. I would like to see them win 9 of remaining 12 at home and another 3 or 4 on the road. That should put them in the 60+ point range.

UPDATE: I’m adding this Orlando passing chart from NYCFC’s 3-0 win. NYC built a damn moat around its goal.

Filed Under: 2017 Weekly Updates NYCFC

2017 MLS Interconference Play – Week 12

May 28, 2017 by Mark Leave a Comment

Week 12 – 7 Games
East Record 5-1-1
At Home 5-0-0
On Road 0-1-1
Goal Differential +11
East Points 16
West Points 4

Season To Date
East Record 21-13-16
At Home 17-3-6 (26)
On Road 4-10-10 (24)
Goal Differential +21
East Points 79
West Points 55

The East is killing it, especially at home. Five wins in five tries this week. The overall home record is perhaps even more impressive. 17 wins against only 3 losses.
Even if the West wins the 2 extra home games it has coming, that leaves the East with a 79-61, 18 point advantage.
The West could only manage one win in its two home games this week. Unfortunately, it was against NYCFC. Last year NYC was much better against the West than the rest of the East was. I don’t think we can count on that repeating this year. Even if NYC does very well by season’s end, the rest of the East might very well keep pace.

Filed Under: Interconference Play 2017

2017 MLS Interconference Play – Week 11

May 16, 2017 by Mark Leave a Comment

Week 11 – 7 Games
East Record 3-1-3
At Home 3-1-1
On Road 0-0-2
Goal Differential +6
East Points 12
West Points 6

Season To Date
East Record 16-12-15
At Home 12-3-6 (21)
On Road 4-9-9 (22)
Goal Differential +10
East Points 63
West Points 51

Big slate of 7 matches this week.
NYC played its second game against the West and has one Win and one Tie.
The East manages to get points on the road this year, getting a result in 13 games while losing 9. In contrast, the West on the road has gotten results in only 9 games while losing 12.

Filed Under: Interconference Play 2017

NYCFC 2017 Weekly Update By The Numbers – MLS Week 10 May 8

May 16, 2017 by Mark Leave a Comment

Note: This post was written last week and I neglected to publish it here so all data and observations are accurate (or should be) as of May 8.

One-quarter into the season, we have enough data to at east pretend we can draw conclusions and make predictions. NYCFC is off to its best start ever. 16 points in 9 games. Third place in the conference. Sixth place overall, and fifth place overall in Points Per Game. It is by far the team’s best first quarter, and leaves me wondering what the narrative thread of this site will be this year. In 2015 it was the unlikely and ultimately unsuccessful quest for the playoffs. Last year it started as a playoff quest: After 9 games last year, six of which were at home, the team had only 2 wins, and 10 points in this 9 games for 1.11 PPG. The playoffs were very much an uncertain destination. On June 2 the team had only 18 points after 15 games for a measly 1.2 PPG and a projected 41 points for the year. It was not until a 4-game winning streak that finished on July 6 that the playoffs became a likelihood, and the rest of the season was spent figuring out whether the team could attain the Supporters Shield, First place in the East, or a CCL berth. It failed in all three, but it went down to the last few games of the season before that became certain.

This year the playoffs seem highly likely, but it is also a bit early to tell where anyone stands for first place in the East or overall. Also, due to the CCL format changes, there is no CCL berth to be won during the regular season. So I’m not sure what to measure for in terms go achieving goals, but that won’t stop me going on anyway.

Let’s start with the basics of the East Conference PPG standings:

NYC is third here just as in the regular standings, with a projected 60-61 points. It’s a bit astonishing that this puts NYC only in third, but TFC and Orlando got off to very strong starts, and TFC at least figures to challenge for 1st place as well as the shield. Over in the West, by the way, Dalls has a 2.25 PPG that projects out to a cool 76.5 points at season’s end.

The East conference playoff line stands at 43-45 points, which seems close enough. I trust this more than I do the first place projections, because the latter is a product of one team as an outlier while the playoff line is a product of 11 teams combined. NYC will really have to falter if it is to cause any worry about making the playoffs. There are 25 games left and this is how various finishes play out. All lines are in standard MLS W-L-T format:

14 6 5 — 1.88 63 pts
12 7 6 — 1.68 58 pts
11 8 6 — 1.56 55 pts
10 8 7 — 1.48 53 pts
9 9 7 — 1.36 50 pts
8 10 7 — 1.24 47 pts
9 13 3 — 1.20 46 pts
9 15 1 — 1.12 44 pts
8 14 3 — 1.08 43 its

For contrast, here is the same list after 9 games last year.
14-6-5 1.88 57
13-6-6 1.80 55
12-9-4 1.60 50
11-8-6 1.56 49
11-6-8 1.64 51
10-8-7 1.48 47
9-9-7 1.36 44
9-11-5 1.28 42
8-11-6 1.20 40

Now is the time for fun with charts. You might remember that 2016 looked better, but still very similar to 2015 for much of the season. Not this year.

Here is a new one:

Finishing up with assorted points:

  • Remember when Portland and Atlanta ruled the GD table because of piling it on against Minnesota in the first two games? They’re both down to +5, tied for 6th overall, and below our 7+.
  • Orlando’s GD is down to 0. They have made very efficient use of their goals, winning close and losing big.
  • Some weeks ago someone else, I can neither remember nor find who, noted that NYC was the only team in top 5 in the league for both Goals scored and Goals Against. I have followed that and NYC is still in that club at spot #4 on both sides. But Toronto has also joined the Double Top 5 club.
  • As mentioned, last year at this point NYCFC was 2-3-4 with 10 points in 9 games. One notable cause of the disappointing start was a tendency to give up goals on set pieces. Through 9 games NYC conceded 3 such goals, all on free kicks: Perquis for Toronto, Tierney for New England, and Oduro with a heartbreaker for Montreal at minute 90. Every one of those came in a tie, so if you indulge the fallacy that everything else happens exactly the same, NYC would have had 6 more points and a record of 5-3-1, with 16 points in the first 9 games. That is exactly the actual team record in 2017. As better as the team has looked overall, you could argue the difference in results is solely to not giving up any set piece goals. I don’t think that explains everything, but it is something.

Filed Under: 2017 Weekly Updates NYCFC

2017 MLS Interconference Play – Week 10

May 16, 2017 by Mark Leave a Comment

Week 10 – 4 Games
East Record 1-2-1
At Home 0-0-0
On Road 1-2-1
Goal Differential -5
East Points 4
West Points 7

Season To Date
East Record 13-11-12
At Home 9-2-5 (16)
On Road 4-9-7 (20)
Goal Differential +4
East Points 51
West Points 45

Given there were 4 road games this week for the East, and none at home, this is a respectable showing. Orlando losing 0-4 killed the GA.
Overall the East has 2 more wins even though the West has played 4 more home games. And I have to eat my words from the prior Interconference Play post. Someone else is keeping track and this was discussed in the comments of an MLSoccer.com article and everyone seemed to accept it. Some West supporters argued they are still better (and the teams are deeper) at the top, and I’ll give them Dallas at least. But Portland is slipping and SKC has little depth. And the West supporters on this article acknowledged that the East is better than previously and overall is an even match for the West at least.

Filed Under: Interconference Play 2017

2017 MLS Interconference Play – Week 9

May 16, 2017 by Mark 1 Comment

Sorry for not keeping up. Her are some catch-up posts.

Week 9 – 5 Games
East Record 2-1-2
At Home 2-1-0
On Road 0-0-2
Goal Differential +3
East Points 8
West Points 5

Season To Date
East Record 12-9-11
At Home 9-2-5
On Road 3-7-6
Goal Differential +9
East Points 47
West Points 38

Home and Away is even at 16 each way. East is 3 wins better than the West. West Conference fans commenting on mlsoccer.com will be the last to figure it out, and the hardest hit when they do.

Filed Under: Interconference Play 2017

About Page and My Other Blogs

About and the Rules

Privacy

My Photo Blog

My Dad’s Autograph Collection and Sketches

Other NYCFC Sites

NYCFC Forums

The Outfield

Categories

  • 2015 Weekly Updates
  • 2016 NYCFC Assorted
  • 2016 Weekly Updates NYCFC
  • 2017 Weekly Updates NYCFC
  • 2018 Weekly Updates
  • 2019 Interconference Play
  • 2019 Weekly Updates
  • Interconference 2018
  • Interconference Play 2016
  • Interconference Play 2017
  • Methodologies
  • MLS Assorted
  • NYCFC Misc

Archives

  • September 2022
  • May 2022
  • November 2020
  • October 2020
  • July 2020
  • June 2020
  • October 2019
  • September 2019
  • August 2019
  • July 2019
  • June 2019
  • May 2019
  • April 2019
  • January 2019
  • November 2018
  • October 2018
  • September 2018
  • August 2018
  • July 2018
  • June 2018
  • May 2018
  • April 2018
  • March 2018
  • November 2017
  • October 2017
  • September 2017
  • August 2017
  • July 2017
  • June 2017
  • May 2017
  • April 2017
  • October 2016
  • September 2016
  • August 2016
  • July 2016
  • June 2016
  • May 2016
  • April 2016
  • March 2016
  • August 2015

Recent Posts

  • Goal Differential Minus xGoal Differential – Spoiler: It’s About Cushing
  • NYCFC May 30, 2022 – Odds’n’Ends, Shapes and Contrasts
  • NYCFC 2020 In Review By The Numbers
  • The Best of Times, The Worst of Times
  • NYCFC 2020 – 15 Games In – 8 To Go

Recent Comments

  • JC on NYCFC May 30, 2022 – Odds’n’Ends, Shapes and Contrasts
  • visit this link on Boys Keep Swinging — NYCFC Weekly Update MLS Week 26 September 2, 2019
  • Mark on If Every MLS Team Were A Ride At Disney World
  • Michael B Parker on If Every MLS Team Were A Ride At Disney World
  • If Every MLS Team Were A Ride At Disney World on In My Beginning Is My End – NYCFC Weekly Update October 7, 2019 MLS Week 31

Meta

  • Log in
  • Entries feed
  • Comments feed
  • WordPress.org

Copyright and Disclaimers

Copyright (c) Mark Garbowski 2015-2019. All rights reserved.

I have no ads or commercial interests in connection with this blog so I need no disclaimers.

Copyright © 2023 · Agency Pro on Genesis Framework · WordPress · Log in