City Blues By The Numbers

You are here: Home / 2017 / Archives for October 2017

Archives for October 2017

NYCFC 2017 Regular Season — Final Weekly Update

October 28, 2017 by Mark Leave a Comment

Regular Season Wrap Up. Not trying to be comprehensive. First, the last charts. I dropped 2015.

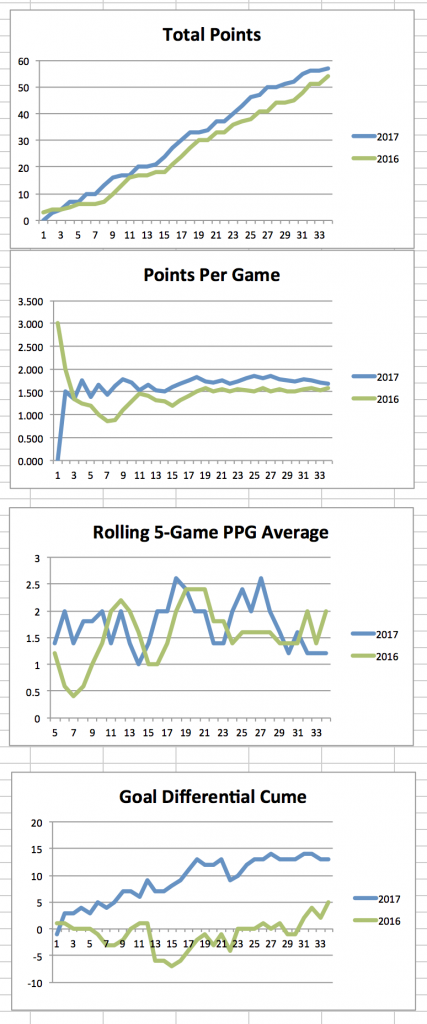
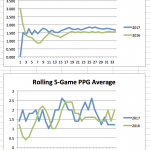
  • The total points lines and PPG for 2015 and 16 look like they kiss around week 11 or 12 but they don’t. 2017 took the lead in Game 5 and never fell back afterwards.
  • On the rolling 5-Game PPG, 2016 was both better and worse in the first part of the season. 2017 did better in the middle third, and then had a bad end. Even with a seesaw chart, 2016 finished better than 2017.
  • After 17 games halfway through the season the Goal Differential was +11. 538 predicted a final GD of +14. I thought they were nuts, and ridiculously undervaluing NYCFC. I expect many others did also. It ended at +13.
  • The GD first hit +13 on June 29 after 18 games. Over the last 16 games the subset GD was 0. After slipping to +9 after the TFC 4-0 loss on July 29, the GD climbed to its high of+14 after the win over SKC on September 9 in Game 27. Over the last 10 games of the season, the GD was either +13 or +14 every week.
  • After 17 games the team had 30 points which projects cleanly to 60, and 538 predicted only 55. It ended at 57.

I tend to divide the seasons into quarters, but a discussion I had elsewhere led me to see how this year is best divided into thirds. As 34 only divides by 2 and 17, the units consist of 12 games, then 11 and 11. Here is a simple table and chart showing how Goals For per game, Goals Against per game, and PPG went in each third of the season:

  • Finally, the Home Away Charts for the year. I do not know why 2 of them make it look like we played more Away games than at Home. It’s a weird Excel thing I can’t figure how to adjust.
  • The odd thing here is that the team had its best results when it had the lowest average Goal Differential. Part of this is luck. In the first third NYC lost 4 games each by one goal, while its average winning margin in 6 games was better than 2. In the middle third NYC won 6 games by a total of 8 goals, while it lost only 3 games by an average differential of more than 2.
  • The other story is that the GA spiked a whole lot in the middle. Then both it and Goals For went way down in the last third, as did PPG. NYC had a lot of missing players during that period, but I have seen comments indicating that fans believed NYC was less aggressive. I have to wonder if Vieira was so concerned about the sharp increase in team defense that he allowed the offense to stagnate as part of what he considered a necessary corrective.


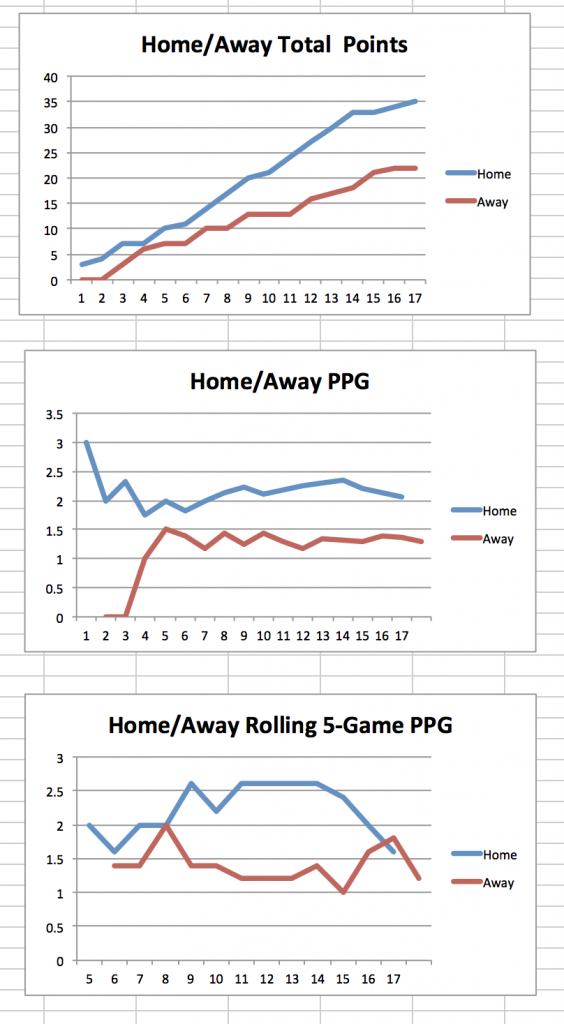
  • No surprises. We were a better Home team all year. In 2016 NYC was actually better Away for half the season. In 2017 NYC earned 5 more points at Home and 2 fewer on the Road compared to 2016.
  • NYC earned 1.77 PPG in Primary Kit games (30 games). 1.33 PPG in the Hypnokit (3 Games), and 0.0 PPG in Eco Kit games (1). Sorry oceans, but that’s a bad performance, especially as it was a Home game.
  • In its 2 years the HypnoKit earned 1.75 PPG in 8 regular season games.
  • NYC performed mildly better against the East (1.69 PPG) than West (1.64). Last year NYC earned 2.0 PPG against the West against only 1.42 against the East. NYC had the odd extra home game against the West and one less against the East which did not apply last year with 10 teams in each conference.

Filed Under: 2017 Weekly Updates NYCFC

2017 MLS Interconference Play — Final Week

October 28, 2017 by Mark Leave a Comment

Week 34 – 1 Game
East Record 0-1-0
At Home 0-0-0
On Road 0-1-0
Goal Differential -3
East Points 0
West Points 3

Season To Date
East Record 51-39-32
At Home 39-11-11 (61)
On Road 12-27-21 (61)
Goal Differential +45
East Points 185
West Points 149

On a PPG basis, the East in 2017 (1.52 PPG) did better than the West in 2016 (1.44 PPG). Ties were down which will inflate the PPG for both sides somewhat (and is a pretty random factor as best as I can tell). There were 30 ties in 2016 (30% of games), and only 32 in 2017 despite playing 22 additional interconference games (26% of games drew).  The East PPG in 2016 was 1.26 which is slightly better than the West’s 1.22 this year.


Filed Under: Interconference Play 2017

2017 MLS Interconference Play — Weeks 31-33 October 16

October 16, 2017 by Mark Leave a Comment

Weeks 31-33 — 3 Games
East Record 1-2-0
At Home 1-1-0
On Road 0-1-0
Goal Differential -2
East Points 3
West Points 6Season To Date
East Record 51-38-32
At Home 39-11-11 (61)
On Road 12-26-21 (60)
Goal Differential +48
East Points 185
West Points 146

One game to go, Houston hosting Chicago. Won’t make much difference either way to this record, though it does have significant playoff positioning implications.

Filed Under: Interconference Play 2017

2017 MLS Interconference Play – Week 30 October 4

October 4, 2017 by Mark Leave a Comment

Week 30 – 4 Games
East Record 2-1-1
At Home 1-0-1
On Road 1-1-0
Goal Differential +4
East Points 7
West Points 4

Season To Date
East Record 50-36-32
At Home 38-10-11 (59)
On Road 12-26-21 (59)
Goal Differential +50
East Points 182
West Points 140

Only 4 games left, though as of when I’m posting this one of those 4 has been played (MIN beat ATL, YAY).

Filed Under: Interconference Play 2017

NYCFC Update: 32 Games In and The Past Is A Foreign Country

October 1, 2017 by Mark Leave a Comment

“Some things are so unexpected that no one is prepared for them. “
 
NYC scored 1.84 Goals per Game through 25 games on August  19, and has 0.86 Goals per Game in the 7 games since then.
NYCFC’s  PPG was 1.84 through 25 games, it is 1.43 in the last 7, and down to 1.75 overall.
NYC had 4 draws in its first 25 games and 4 in the last 7.
NYC scored at least 2 goals in 16 of its first 25 games and hasn’t done so once in the last 7.
“I have seen the future and it is very much like the present, only longer.”
Here are some more trends about other teams that might affect NYC:
Atlanta’s last loss was August 23 and that streak covers 8 games.
New England is in 8th Place but until last night it won every home game it played going back to July 5. It was tied for the 4th best Home record in the entire league.  Toronto has lost 5 games all season and 2 of those 5 were in Gillette Stadium. New England outplayed Atlanta in New England last night and Atlanta still got a point.
NYC’s next game is in New England, who still is tied for 4th Best Home Record.
Minnesota won 0 of its first 10 Away games, but won 2 of the last 4. Minnesota also is still terrible. They have scored 18 goals in their 14 Away Games. Atlanta last conceded a goal at Home in July, in a different stadium. Atlanta has 6 Clean Sheets in its last 7 games.
Atlanta’s next game after Minnesota is in in Harrison, NJ.  It is Atlanta’s last remaining Away game. The Red Bulls have not won Home or Away since August 12.  Their tailspin is far worse than NYCFC’s.  If they beat Vancouver in the intervening game they have nothing meaningful to play for. If they do not beat Vancouver they will have failed to win for 10 straight games when they face Atlanta.
After Minnesota, Atlanta’s streak of games on short rest ends. They will have 11 days off before playing in New Jersey.
“An unsophisticated forecaster uses statistics as a drunken man uses lamp-posts – for support rather than for illumination. “
 
If Minnesota gets any result in Atlanta next week that will be huge.  If Minnesota gets a draw, NYC will go into the final 2 games with a major advantage, but would still have to win both of the last 2 games to be guaranteed second regardless of what Atlanta did from that point. If Minnesota manages a win, NYC has some more flexibility.
If Atlanta beats Minnesota as expected, they will be tied with NYC on points and a massive advantage on tiebreakers. Both will have 2 games left.
October 15: Atlanta Away at Red Bull Arena; NYC Away at New England. Playing in New England is the tougher game. Just ask Toronto. But NYC is a better Away team than Atlanta.
October 22: Atlanta hosts Toronto; NYC hosts Columbus. Toronto is making MLS history. They also have the best Away record in the league. Atlanta has the third best home record in the league. The entire league is looking forward to this game. I consider it a toss-up.  Toronto will be playing for nothing that matters, except maybe pride and sending a message against a potential playoff opponent.  They could rest their best and just try to avoid injury, or go all out.
  • If NYC comes out of October 15 3 points behind Atlanta then NYC cannot catch up given the tiebreakers.
  • If NYC comes out of Oct 15  2 points behind Atlanta NYC gets second by beating Columbus and an ATL loss.
  • If NYC comes out of Oct 15  1 point behind Atlanta NYC gets second by beating Columbus and an ATL draw or loss.
  • If NYC comes out of Oct 15  even with Atlanta NYC gets second with any better result than Atlanta. A win against Columbus means nothing without some result for Toronto.
  • If NYC comes out of Oct 15 1 point ahead, NYC gets second with a win, or a draw and Atlanta draw or loss, or a loss and Atlanta loss.
  • If NYC comes out of Oct 15 2 or 3 points ahead, NYC gets second with a win, or a draw and Atlanta draw or loss, or a loss and Atlanta loss or draw.
“Current trends always seem like they will go on forever, until they don’t.”
Back in mid-August, nobody expected NYC’s to go 7 games without scoring 2 goals, or that the Red Bulls would not only slump but completely stop winning, or that Minnesota would win 2 of 4 Away games, or that Atlanta would have 6 shutouts in 7 games.
NYC needs a turnaround. Predicting it would be foolish. Being surprised if it happens would be even dumber.
Let’s hope.

Filed Under: 2017 Weekly Updates NYCFC

About Page and My Other Blogs

About and the Rules

Privacy

My Photo Blog

My Dad’s Autograph Collection and Sketches

Other NYCFC Sites

NYCFC Forums

The Outfield

Categories

  • 2015 Weekly Updates
  • 2016 NYCFC Assorted
  • 2016 Weekly Updates NYCFC
  • 2017 Weekly Updates NYCFC
  • 2018 Weekly Updates
  • 2019 Interconference Play
  • 2019 Weekly Updates
  • Interconference 2018
  • Interconference Play 2016
  • Interconference Play 2017
  • Methodologies
  • MLS Assorted
  • NYCFC Misc

Archives

  • September 2022
  • May 2022
  • November 2020
  • October 2020
  • July 2020
  • June 2020
  • October 2019
  • September 2019
  • August 2019
  • July 2019
  • June 2019
  • May 2019
  • April 2019
  • January 2019
  • November 2018
  • October 2018
  • September 2018
  • August 2018
  • July 2018
  • June 2018
  • May 2018
  • April 2018
  • March 2018
  • November 2017
  • October 2017
  • September 2017
  • August 2017
  • July 2017
  • June 2017
  • May 2017
  • April 2017
  • October 2016
  • September 2016
  • August 2016
  • July 2016
  • June 2016
  • May 2016
  • April 2016
  • March 2016
  • August 2015

Recent Posts

  • Goal Differential Minus xGoal Differential – Spoiler: It’s About Cushing
  • NYCFC May 30, 2022 – Odds’n’Ends, Shapes and Contrasts
  • NYCFC 2020 In Review By The Numbers
  • The Best of Times, The Worst of Times
  • NYCFC 2020 – 15 Games In – 8 To Go

Recent Comments

  • JC on NYCFC May 30, 2022 – Odds’n’Ends, Shapes and Contrasts
  • visit this link on Boys Keep Swinging — NYCFC Weekly Update MLS Week 26 September 2, 2019
  • Mark on If Every MLS Team Were A Ride At Disney World
  • Michael B Parker on If Every MLS Team Were A Ride At Disney World
  • If Every MLS Team Were A Ride At Disney World on In My Beginning Is My End – NYCFC Weekly Update October 7, 2019 MLS Week 31

Meta

  • Log in
  • Entries feed
  • Comments feed
  • WordPress.org

Copyright and Disclaimers

Copyright (c) Mark Garbowski 2015-2019. All rights reserved.

I have no ads or commercial interests in connection with this blog so I need no disclaimers.

Copyright © 2023 · Agency Pro on Genesis Framework · WordPress · Log in