I didn’t want to write this and nobody wants to read it but here we are:
- NYCFC has lost 6 regular season games all time by 3 or more goals. The Red Bulls claim 3 of them.
- 2015 LAG 5-1
- 2016 RB 7-0
- 2016 RB 4-1
- 2017 TFC 4-0
- 2018 POR 3-0
- 2018 RB 4-0
- That NYC has 2 such losses in just 4 playoff games is beyond abysmal.
- All time, NYC also has 6 Wins of 3 or more goals:
- 2016 Colorado 5-1
- 2016 Chicago 4-1
- 2016 Columbus 4-1
- 2017 DC 4-0
- 2017 Orlando 3-0
- 2018 RSL 4-0
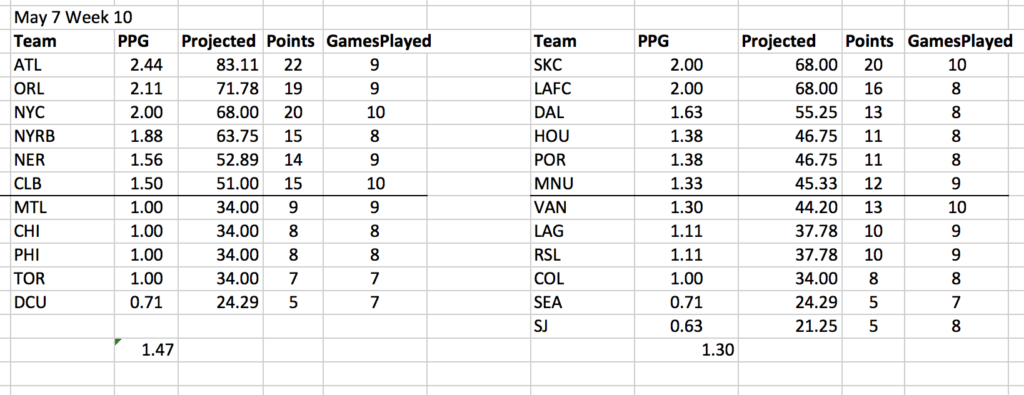
- NYC has slipped to 3rd place on the PPG standings in the East, and a 3-way tie for third league wide. NYC’s next opponent is part of that 3-way

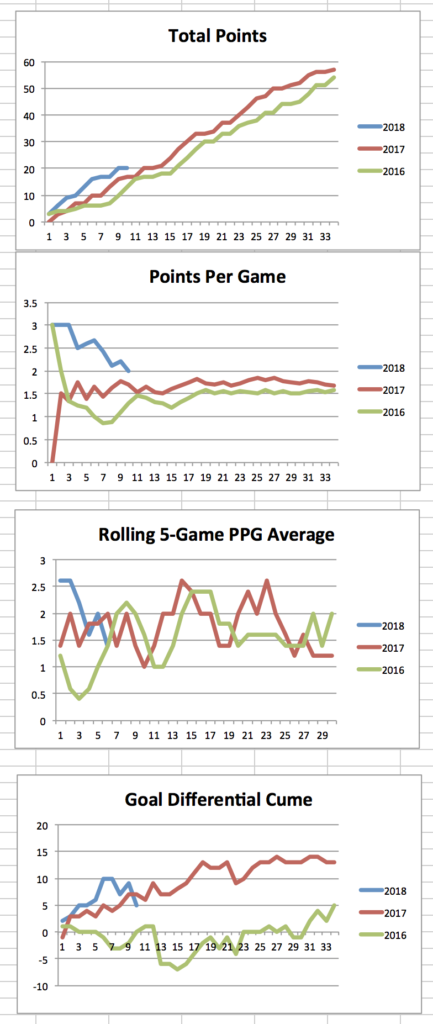
- Consecutive scorelines of 0-3, 3-1, and 0-4 drop the Goal Differential down below where it was last year.

- In its six wins, NYC’s cumulative GD is +12, so when it wins it does so by an average of 2 goals.
- In its 2 losses, the GD is an average of -3.5.
- NYC’s 1.33 PPG in 6 Away games is right between its 2016 record (1.41) and 2017 record (1.29).
- NYC is only at 1-1-2 for 1.25 PPG against the East so far this year. It’s only 4 games, but NYC’s 2.0 PPG is almost entire due to crushing the West at 5-1-0 and 2.50 PPG. On the up side, NYC has had only 1 Home game against the East with 3 Away. On the down side, neither of NYC’s 2 Away wins are against the East.
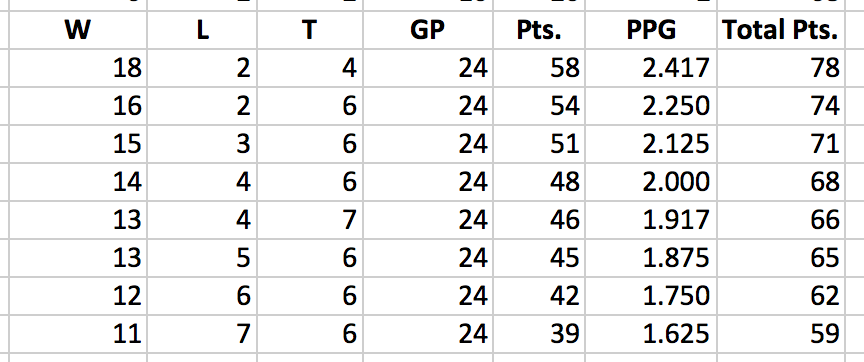
- Two big losses in 3 games feels awful, but many big goals are well within reach, even if a season more or less like the last 2 suddenly seems more likely:

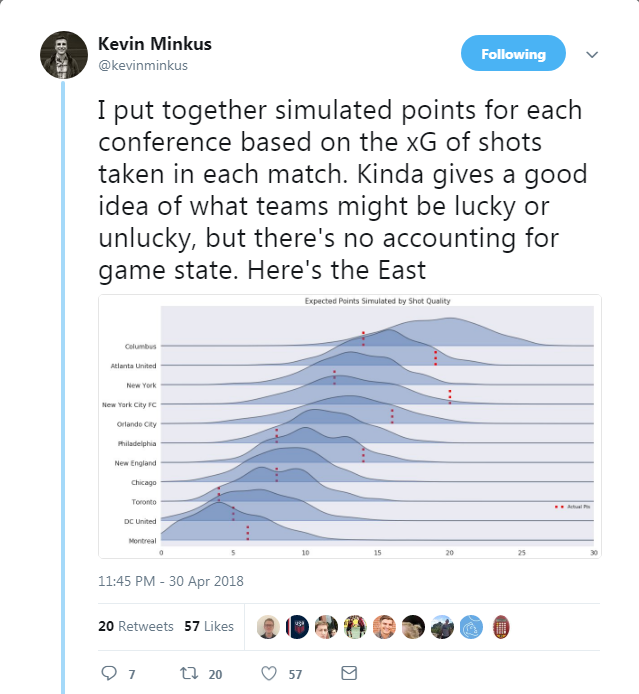
- Finally, here’s a Twitter thread dated about a week ago. Minkus put together a graph showing a bell curve for each team’s likely Total Points based on their xGoals in each match. It takes a minute to figure out how it works but is quite simple once you grasp it. The bottom line is that NYC has been rather lucky in its results according to xGoals. Go down the thread and he has similar graphs using PPG instead of Total Points. You don’t have to think xGoals is perfect to find this unsettling. Click the image to be taken to the original tweet.

Leave a Reply