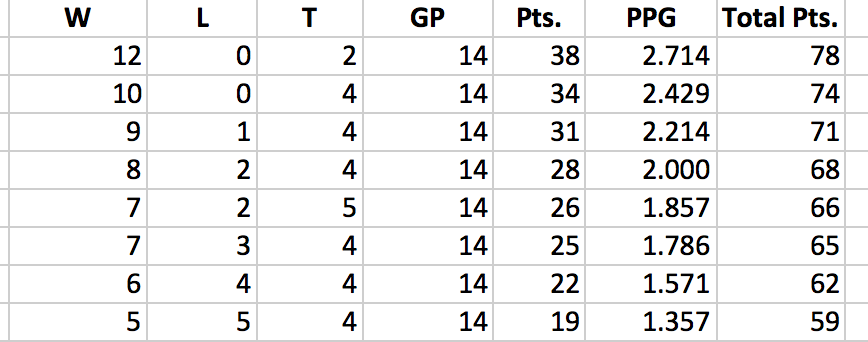
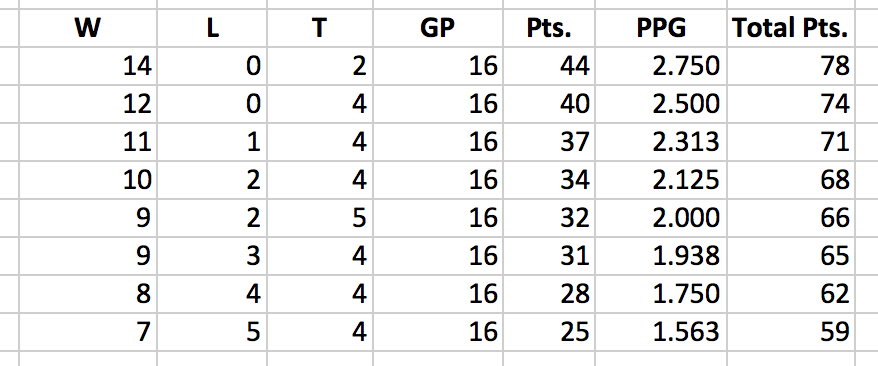
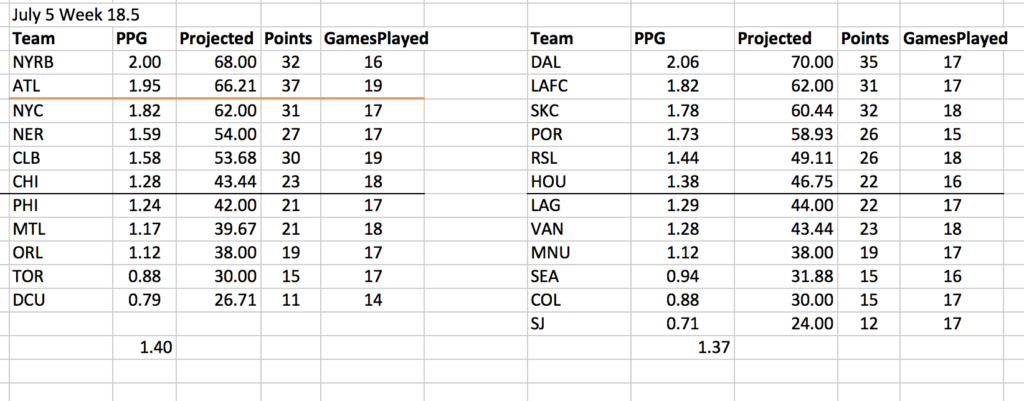
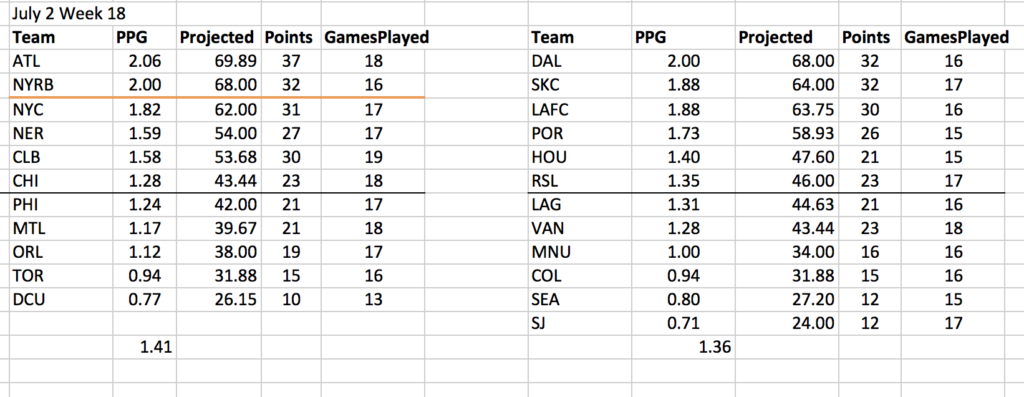
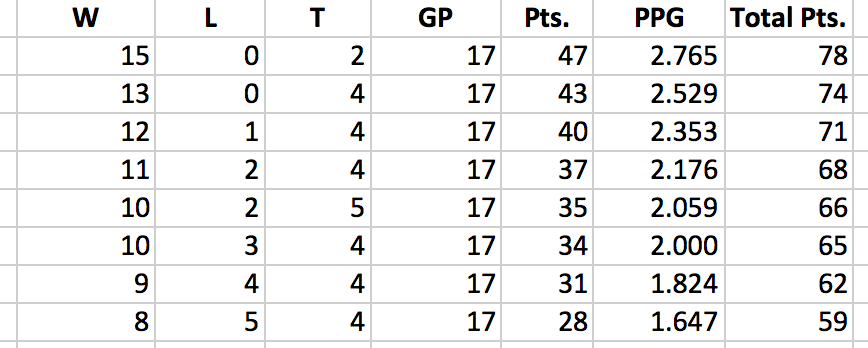
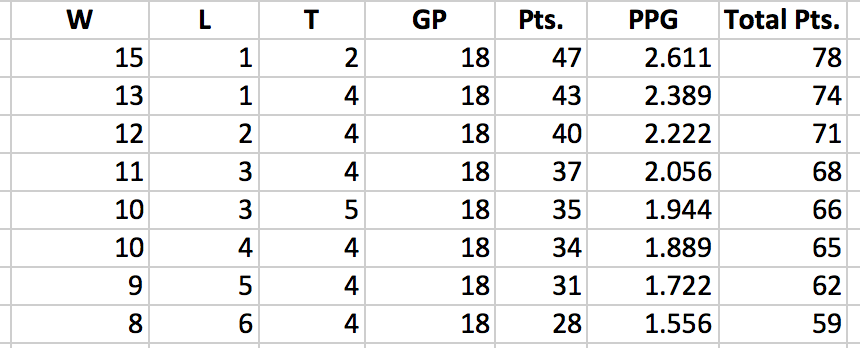
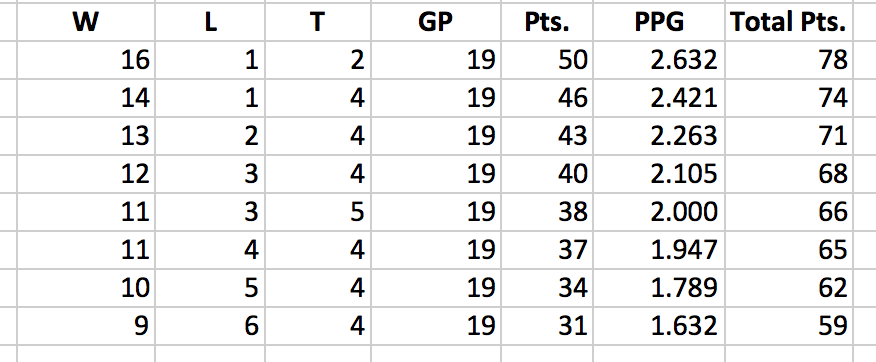
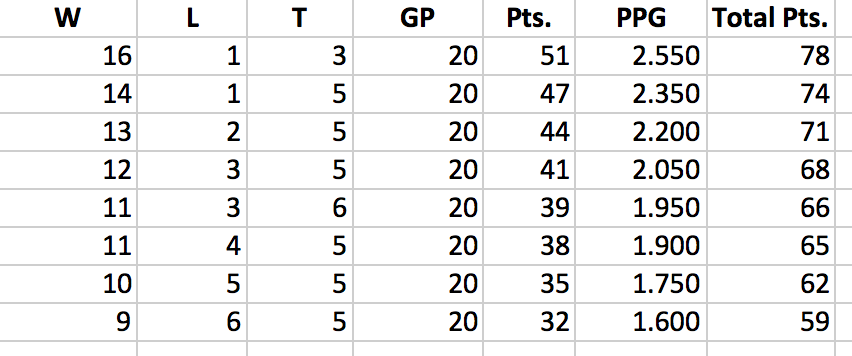
A sad milestone. I dropped the top line from the chart showing sample finishes and total points. It was 78. NYC could potentially finish 12-0-0 and get 79 points, but that’s neither likely nor something for which you need my chart. The plus is the chart had been sitting with a top line that had zero losses for a while without forcing my hand:
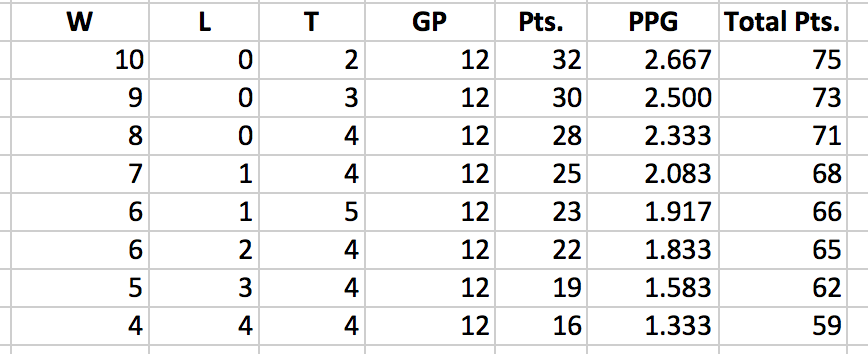
There’s now little room to falter and reach 70, though there are possibilities I don’t show. Nine wins and 1 or 2 losses get to that marker.
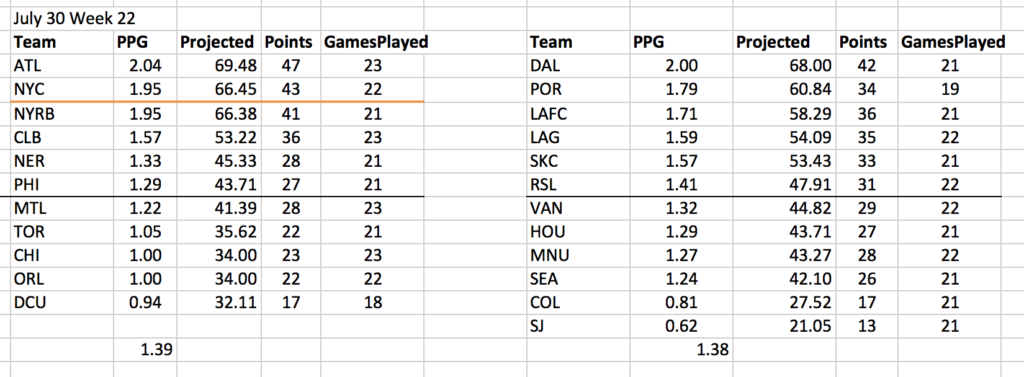
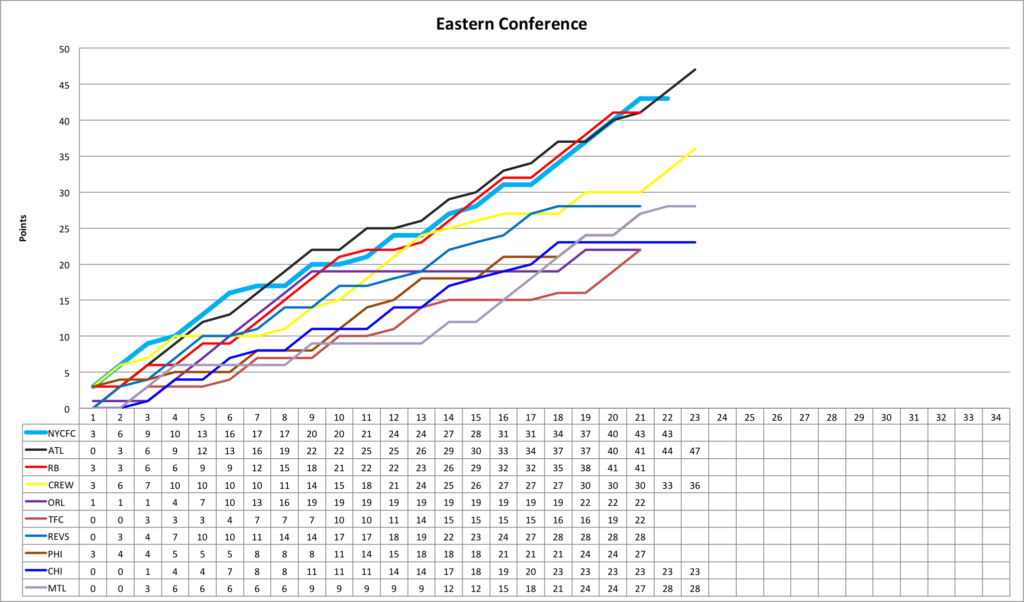
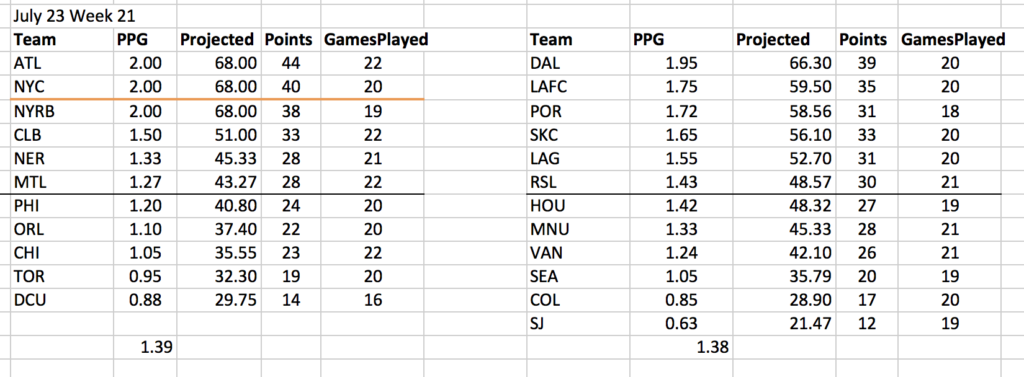
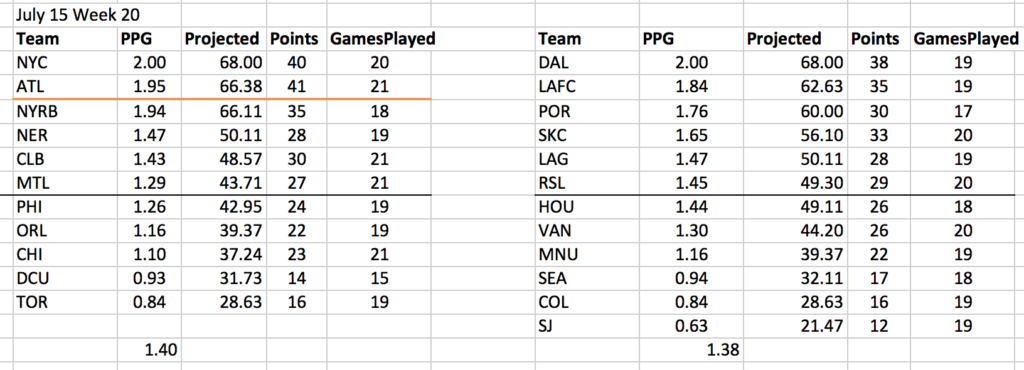
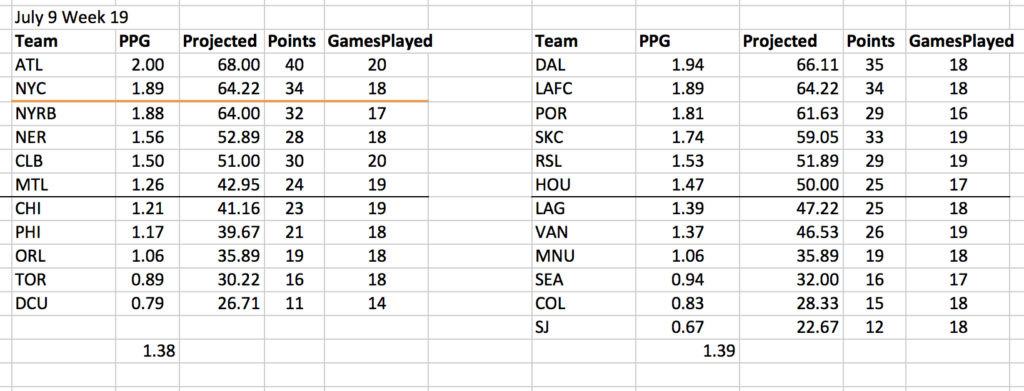
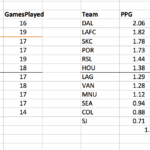
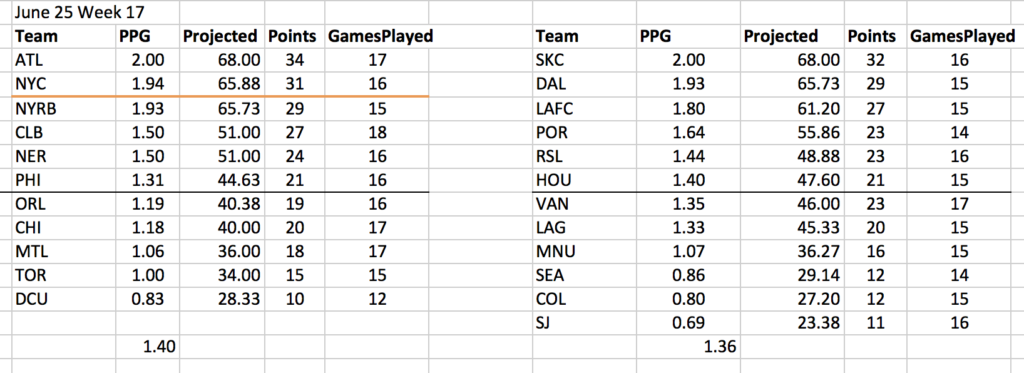
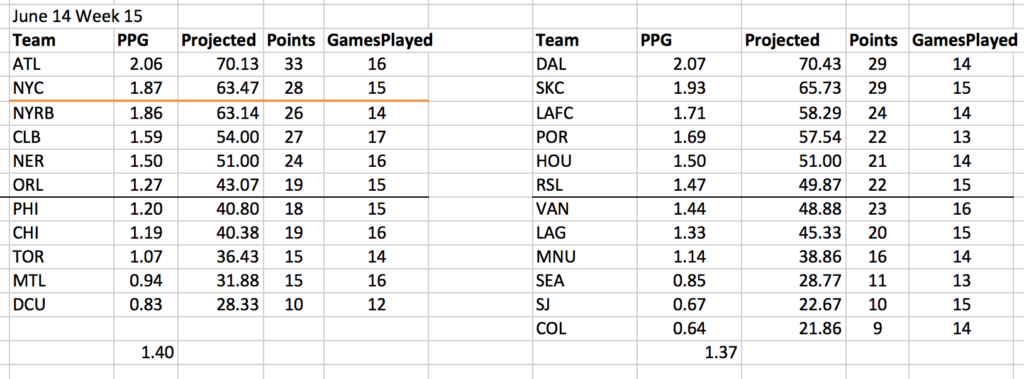
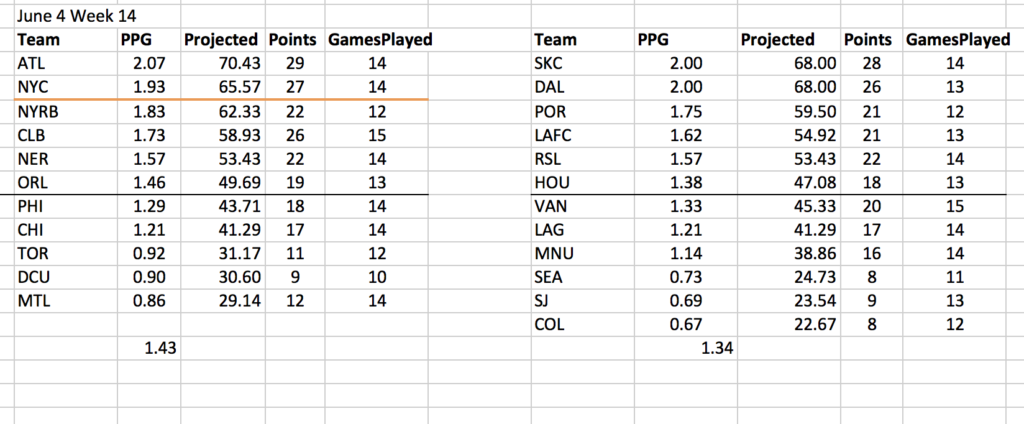
In the previous post on interconference play thread you can see that the West is winning those contests by a bit. The east has a combined higher PPG because the East teams draw less often against each other and that pushes their PPG slightly ahead.
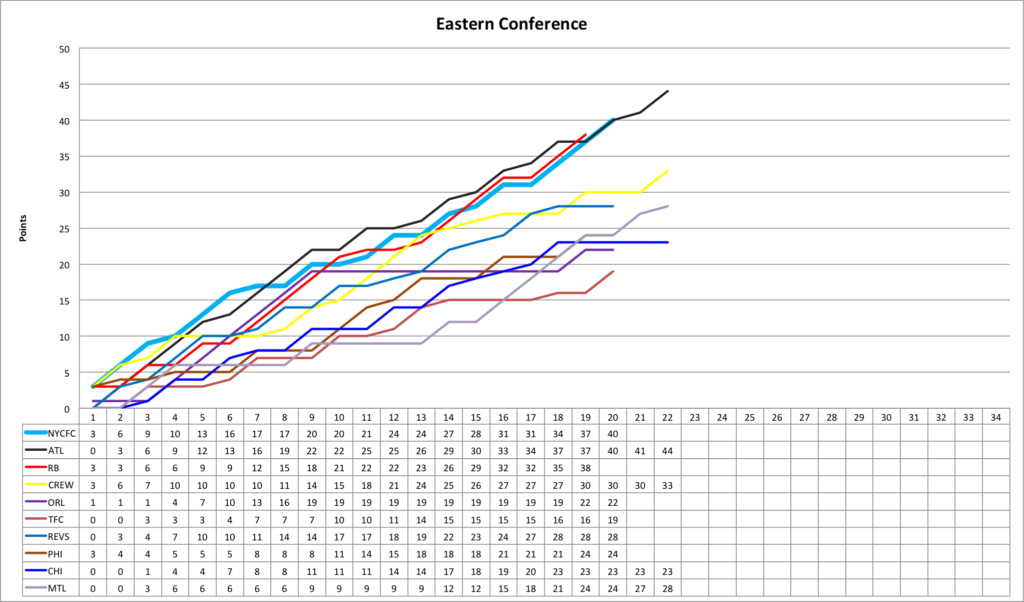
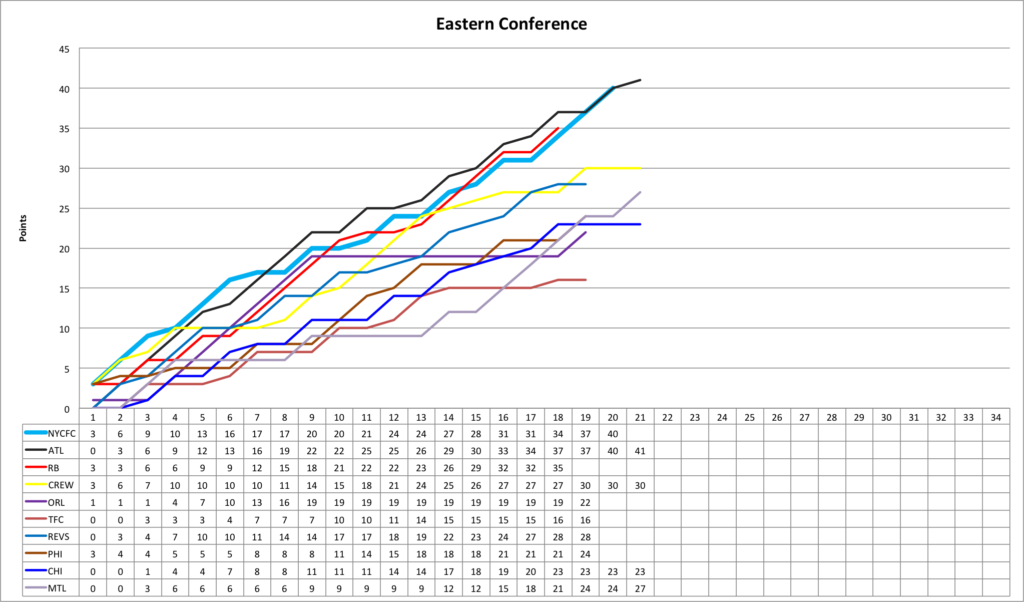
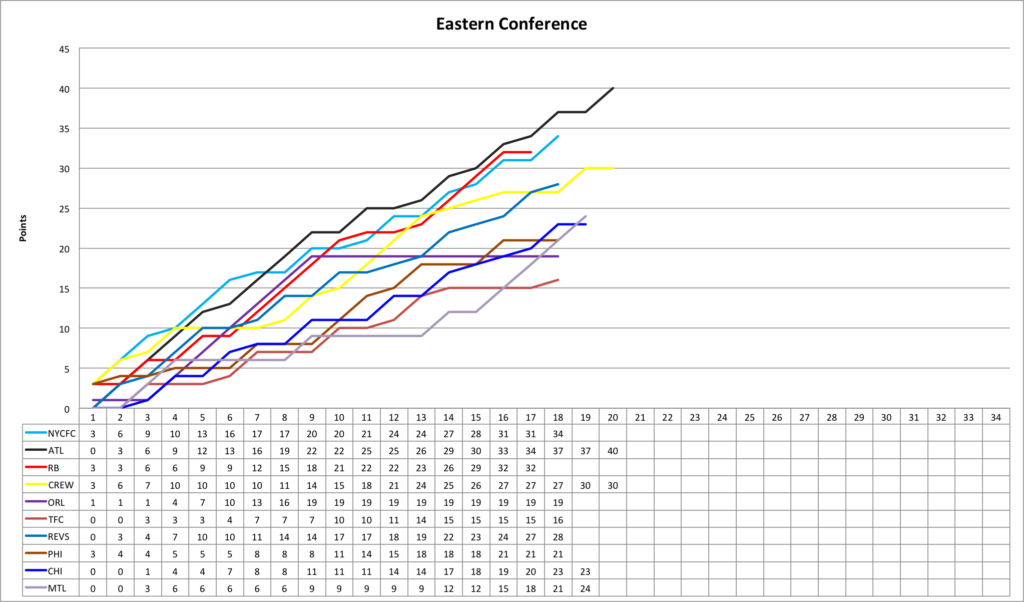
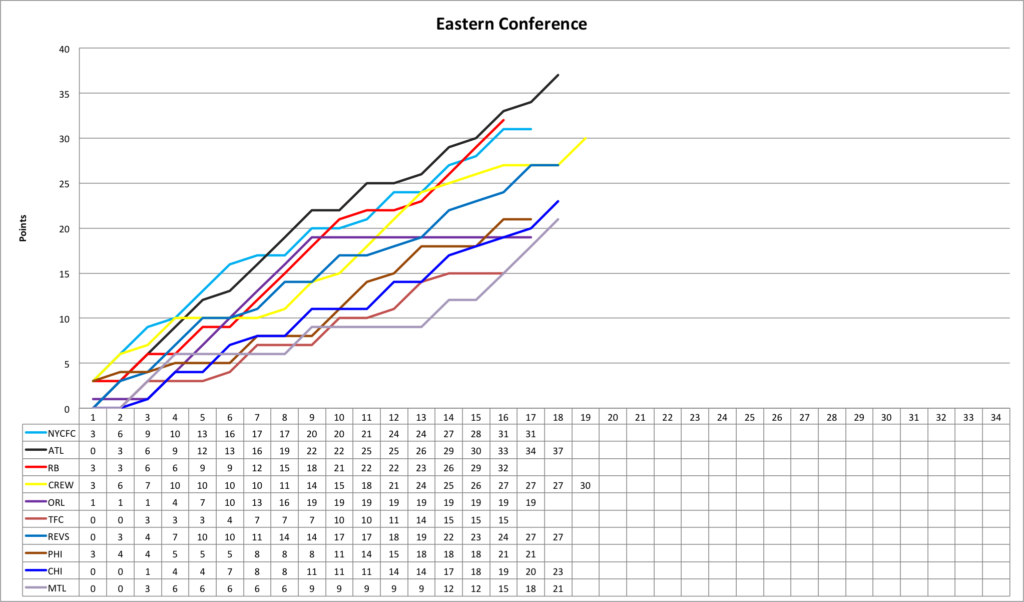
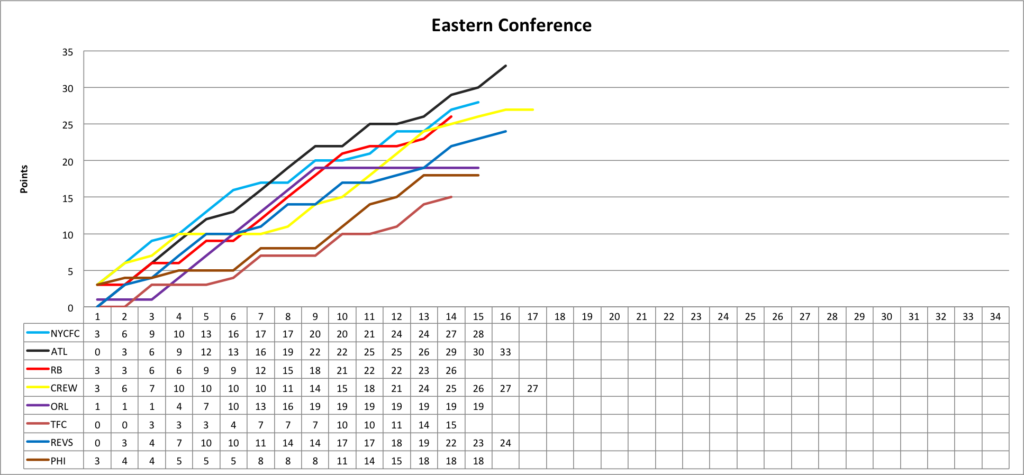
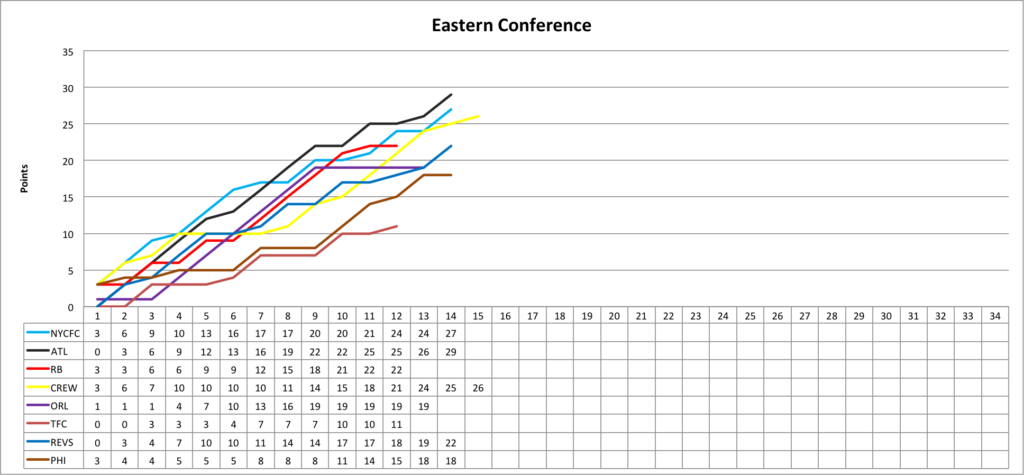
On this chart Toronto just needs to pass 2 teams to make the playoffs, but the gap between Toronto and those teams is substantial. Assuming neither of those teams improves by much, Toronto needs 44-45 points to jump ahead of them. To get 45, TFC needs 23 points in its last 13 games. That would mean, for example, winning at least 6 of their final 7 home games (18 points) and winning 2 of 6 Away for 46 points. But Toronto’s has a very tough schedule. It includes hosting Atlanta, NYCFC, and both LA teams plus Away at Atlanta, Portland, Red Bulls, DC, and Montreal, all excellent home teams. That leaves only 4 relatively easy games Away at San Jose, and home to Montreal, New England, and Vancouver. 2017 Toronto could handle that. 2018 Toronto will earn its way in if it manages to do so.
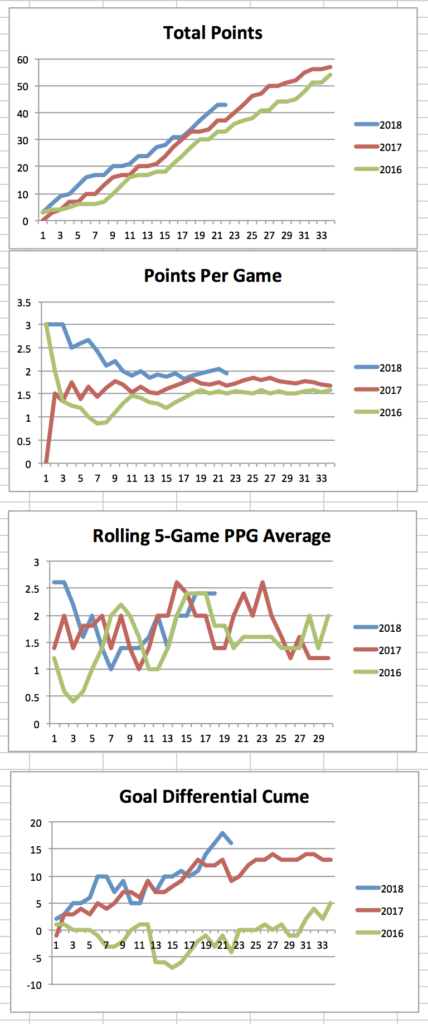
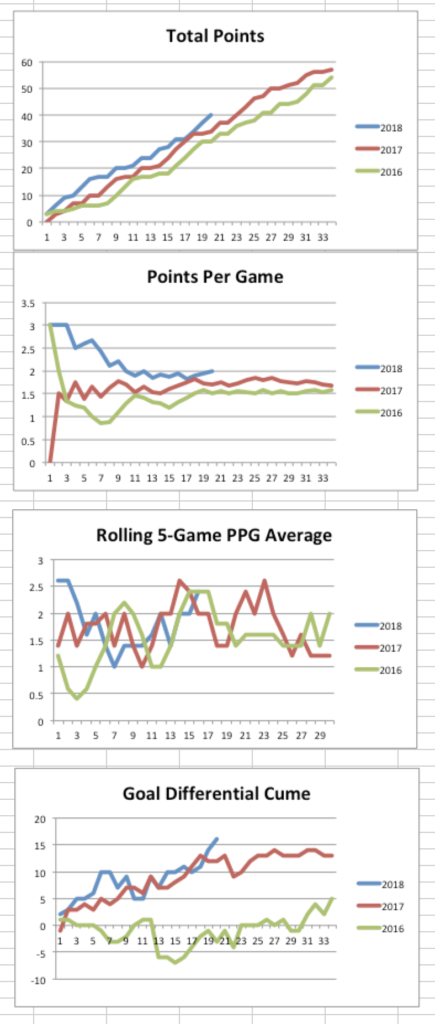
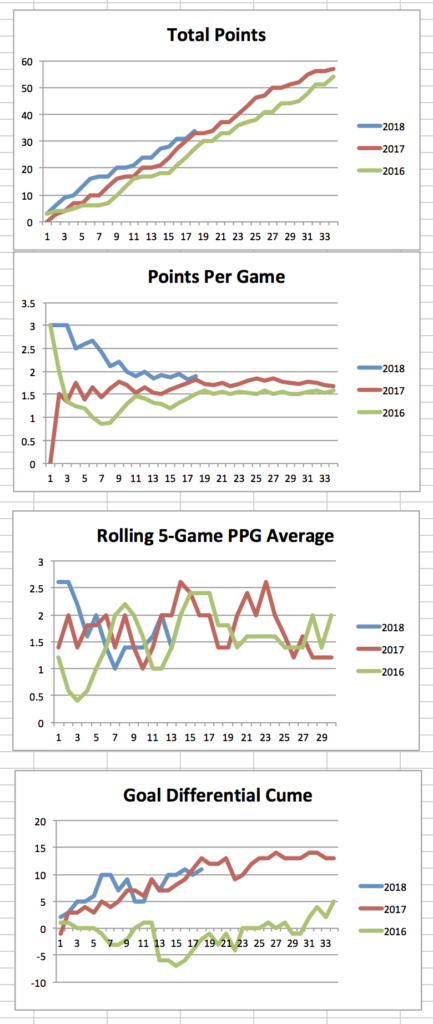
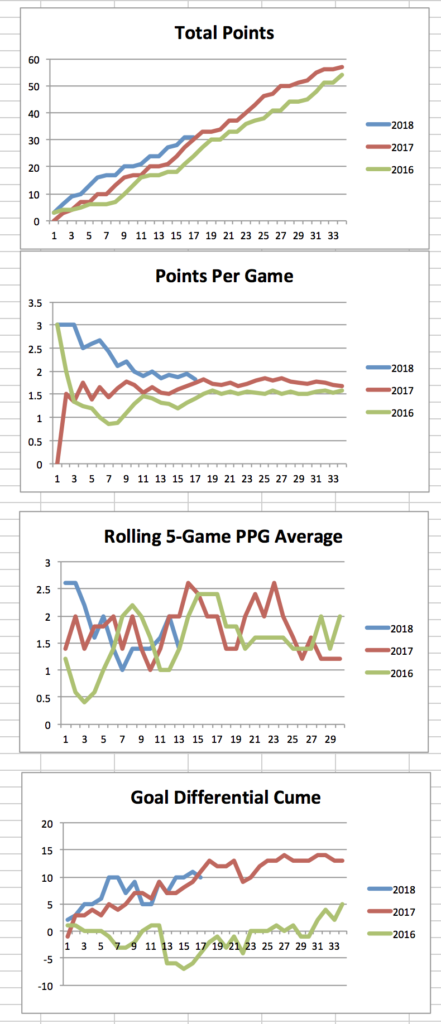
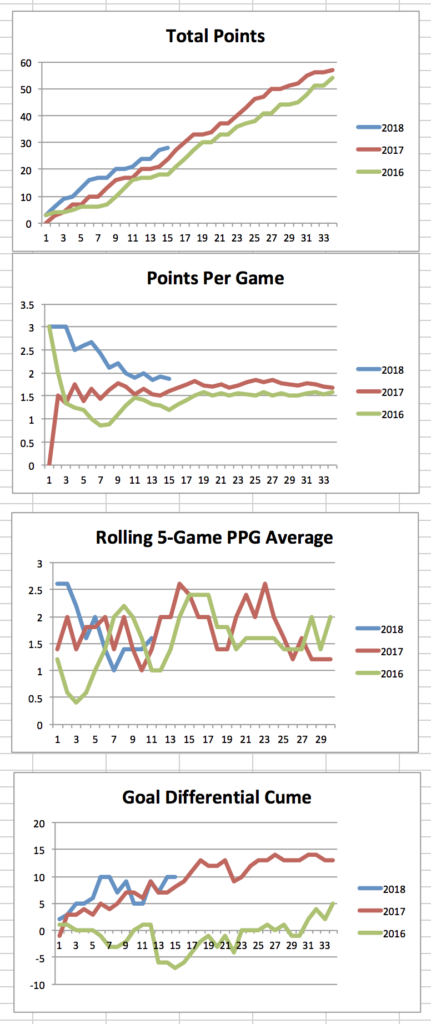
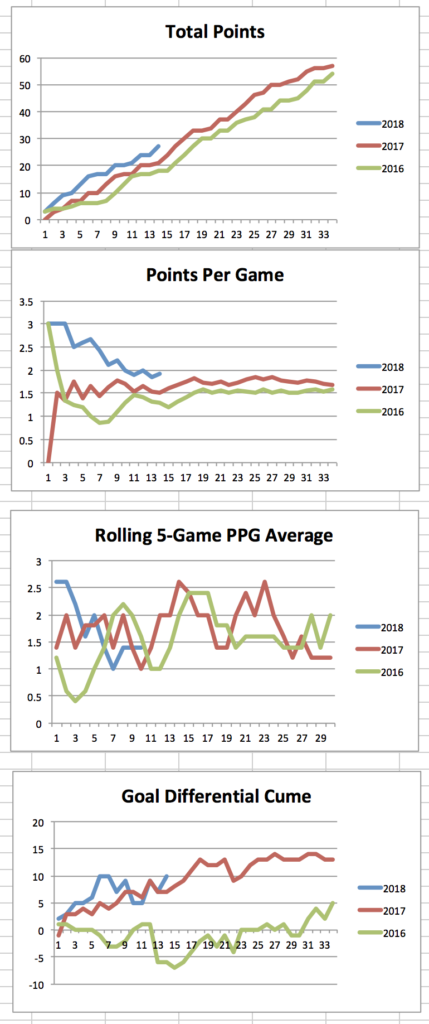
Four straight wins means even a disappointing loss does not push the lines uncomfortably close above any prior seasons.
