It’s been two weeks since the last update.* I didn’t do one last week because drawing on the road against Dallas told us very little, and it seemed more appropriate to treat the Dallas-RSL-Orlando road swing in 8 days as one set even though they were part of separate MLS weeks. But with a bad loss and a great win, we are still in a very similar spot.
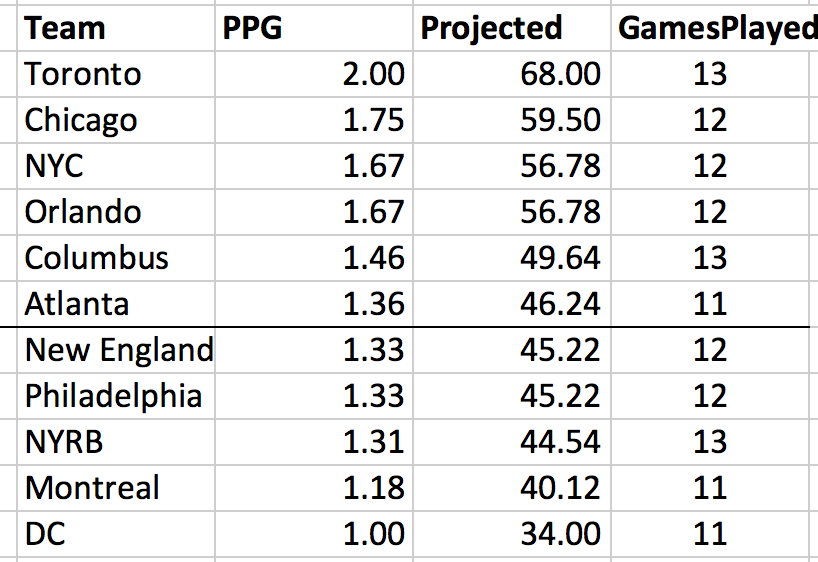
NYC’s PPG dropped from 1.78 to 1.67. Four points from 9 on the road is acceptable but not good.
* Also this was written last Tuesday but only posted barely in time to beat NYC’s Week 13 game against Atlanta.

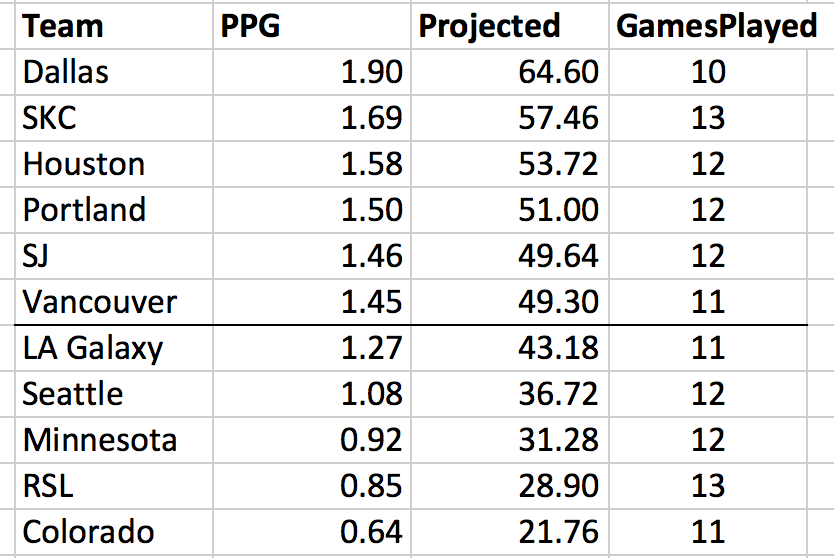
Let’s look at the West table for comparison.

There is only one spot on these tables where the West is better than the east and it is the projected final playoff spot where Vancouver projects to 49 and Atlanta to 46. Probably a quirk and barring a change in inter conference play form the playoff line in the East should be higher than the West.
The bottom teams in the East are showing much better quality than their West counterparts.
Inefficiencies
NYC leads the league in Goal Differential per game. NYC is one of 3 teams to be giving up less than one goal per game (Dallas and SKC are the others). NYC has never given up more than 2 goals in a game. Oddly, however, NYC has only 3 clean sheets. For comparison, Philadelphia has allowed 2 more goals in total with but has 5 clean sheets. NYS is second for goals scored. Atlanta is first with game in hand. NYC is tied for actual total GD with Toronto.
Yet the points do not reflect this apparent dominance. Here’s how:
NYC’s GD in its 3 shutouts is +9, leaving a total GD of 0 in the remaining 9 games. that is not efficient at all. Even considering the 0 GD, a record of 3-4-2 is not particularly fortunate.
NYC has only gave up 2 goals 4 times. And has only scored 1 goal itself 4 times. Three of those four separate instances overlapped for a 2-1 loss. The others were 3-2 win over Columbus and 1-1 draw with Montreal. The only other single goal win was 2-1 over San Jose.
There is no reason to expect this trend to continue, but in a season with only 32 games, there is no reason to expect it to right itself either. But if the team is going to finish at or near the top of the East, it will have to improve.
Mikey and the Cards
Mikey Lopez’s reputation as a yellow card machine is well warranted. He had 6 yellow cards last year in only 672 minutes. His one yellow per every 113 minute pace was highest among players with more than 200 minutes or more than 2 cards.
But he had no straight reds, and he never got two yellows in one game. He got his fifth yellow on May 21 during RBW, then only got one more yellow all year, on July 17 against Montreal. After that 7 appearances, no starts, 110 minutes. Three of his six yellows came in the first half of a game he started and played 78, 90 and 90 minutes an dhe manages not to get a second.
He also never had a red while playing for SKC, about 960 minutes. He has no red cards in his MLS career. So his other reputation as a red card waiting to happen only works in the sense, that, yes, eventually one can expect any streak to end. But his record is not that of a red card magnet. If he plays substantial minutes and does not drop his pace he will, however, see 1 or more suspensions this year for accumulation.
Possession
Average possession in NYC’s 6 wins, 56.0%
Average possession in the 4 losses, 63.7%
Draws 58.4%.
Make of that what you will.
Charts

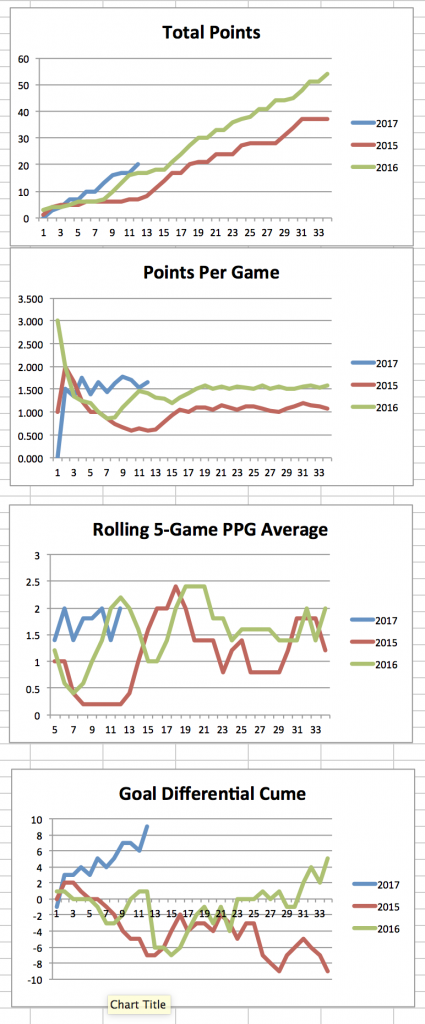
The divergence between this year’s Goal Differential compared to last year, and other metrics compared to last year, is considerable. If you are disappointed that the results do not seem to match the team’s improvement that is why.
What if:
Here are some projected results based on possible finishes over the remaining 22 games, regardless of likelihood.
13-5-4 63
11-6-5 58
10-7-5 55
9-7-6 53
8-8-6 50
7-8-7 48
8-12-2 46
7-13-2 43
6-14-2 40
Really I think the team needs to improve at home. 3-1-1 is fine but not what is needed to finish with an elite record. I would like to see them win 9 of remaining 12 at home and another 3 or 4 on the road. That should put them in the 60+ point range.
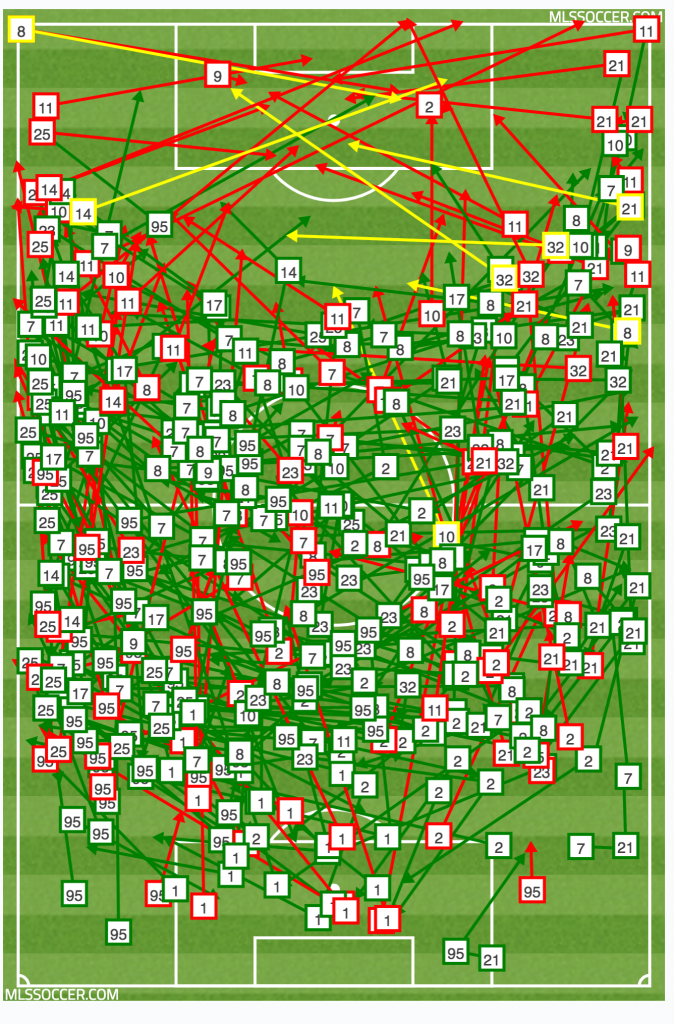
UPDATE: I’m adding this Orlando passing chart from NYCFC’s 3-0 win. NYC built a damn moat around its goal.

Leave a Reply