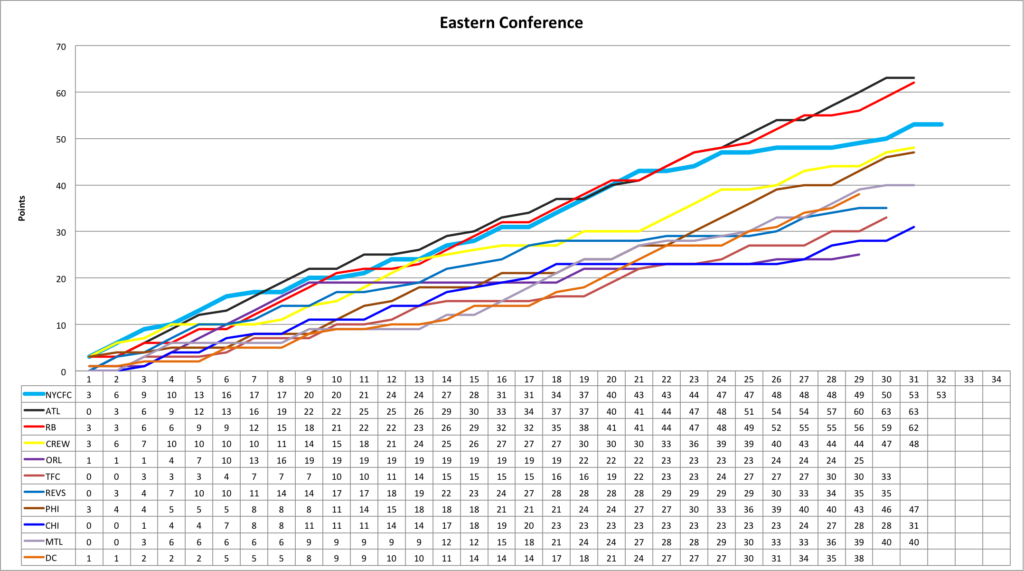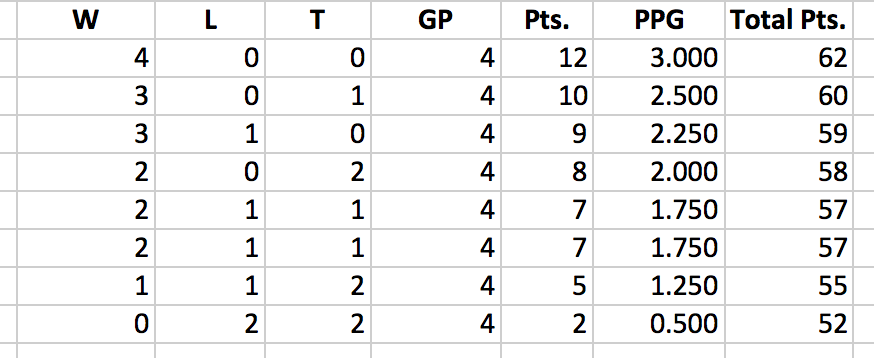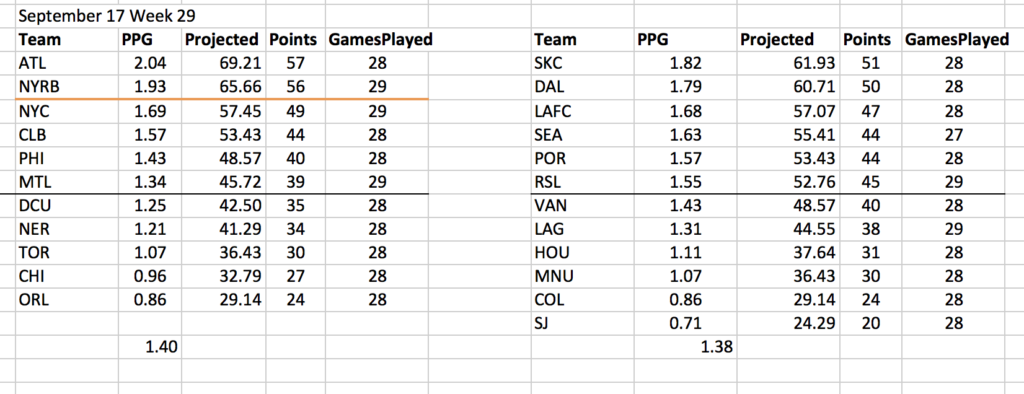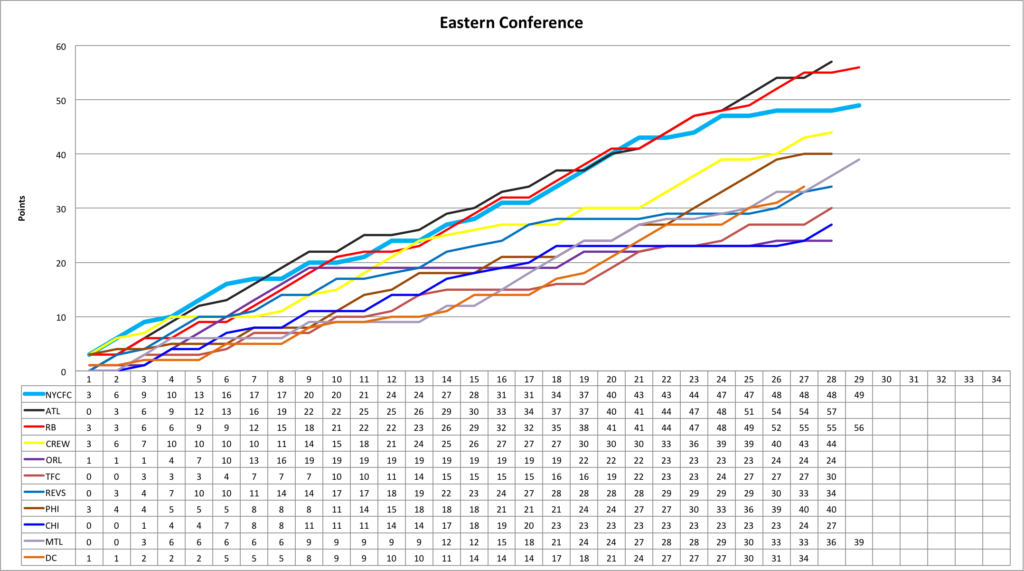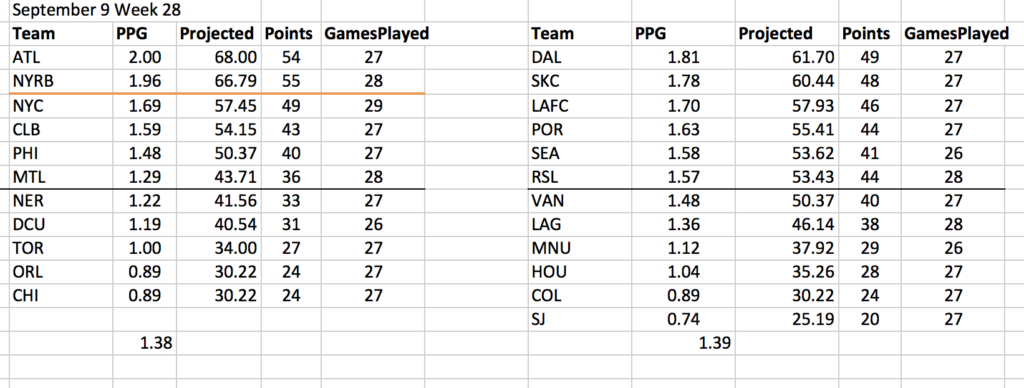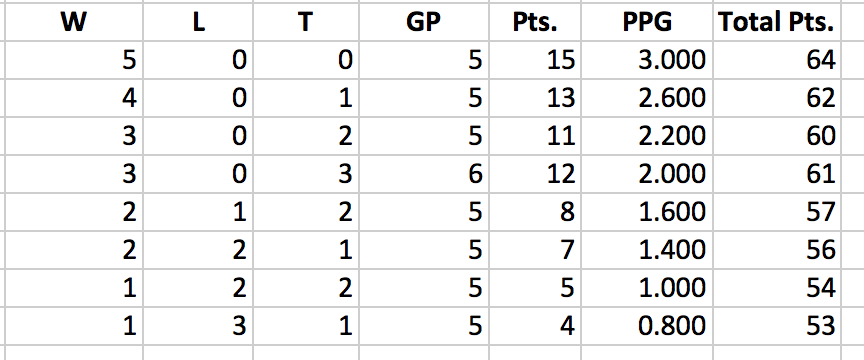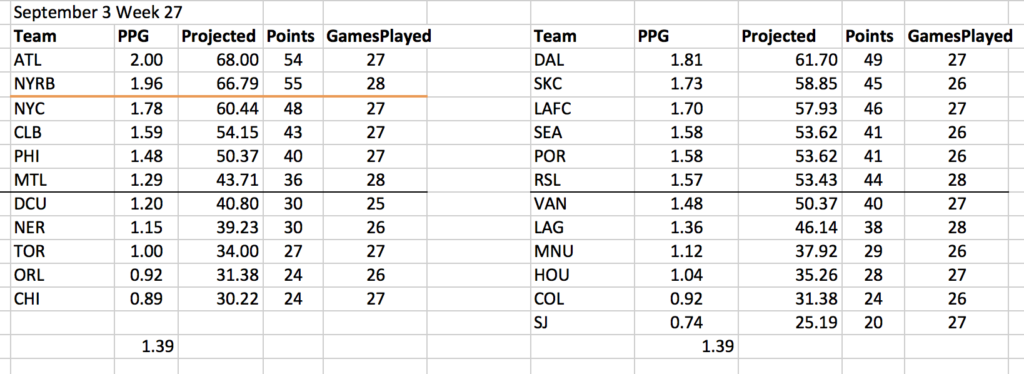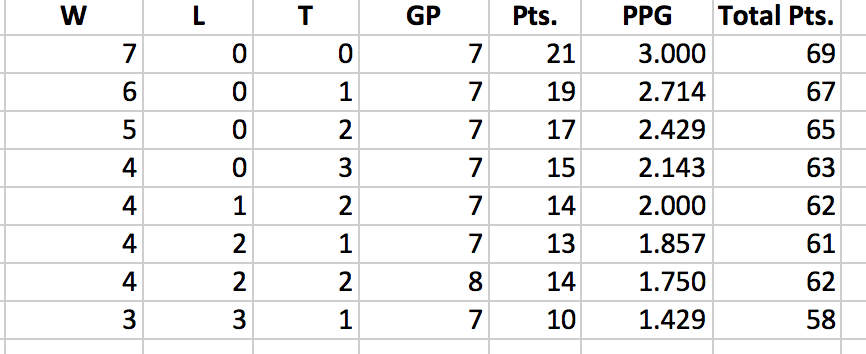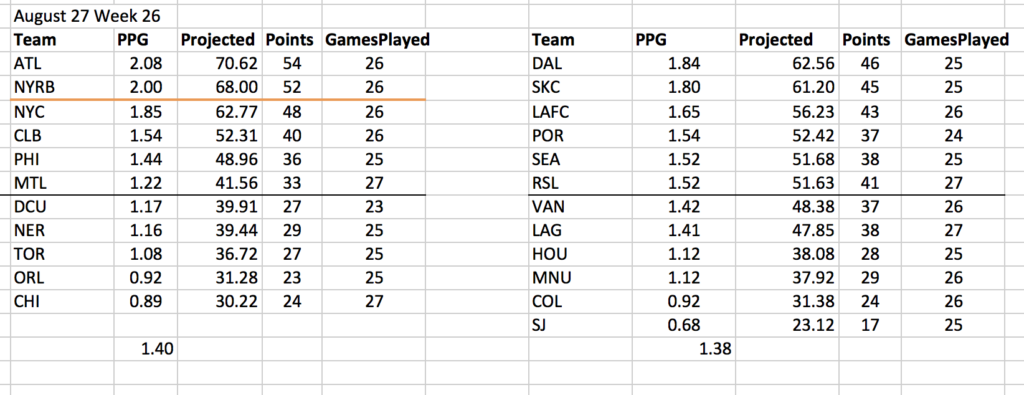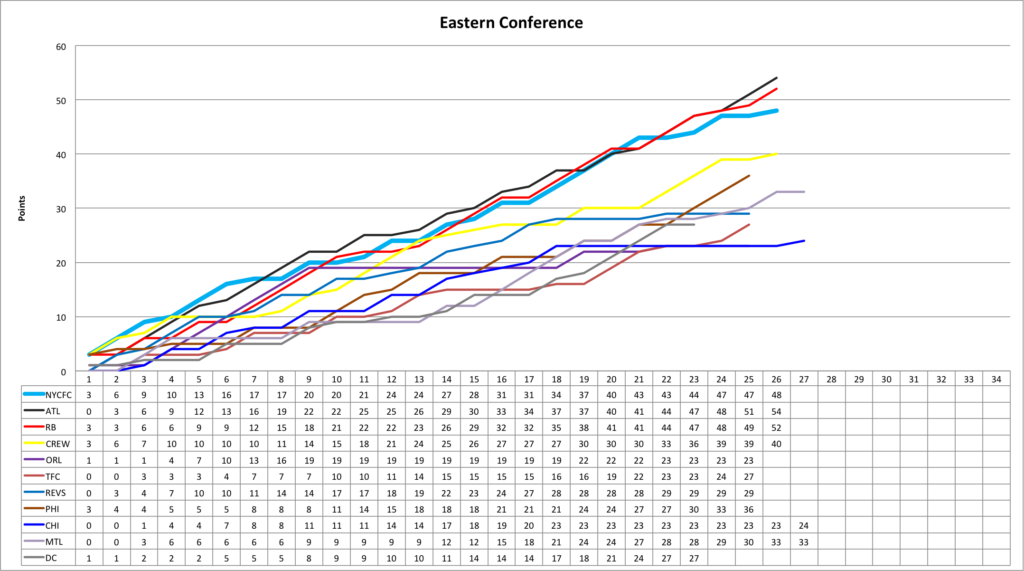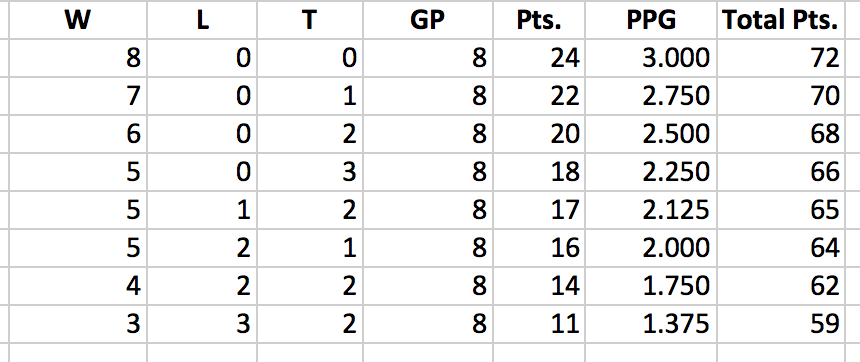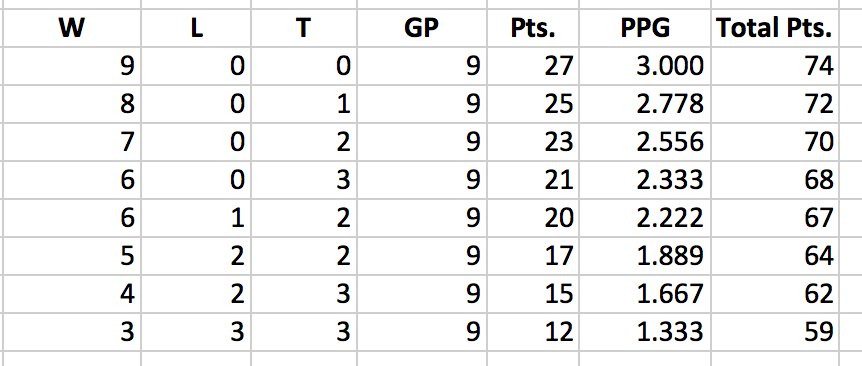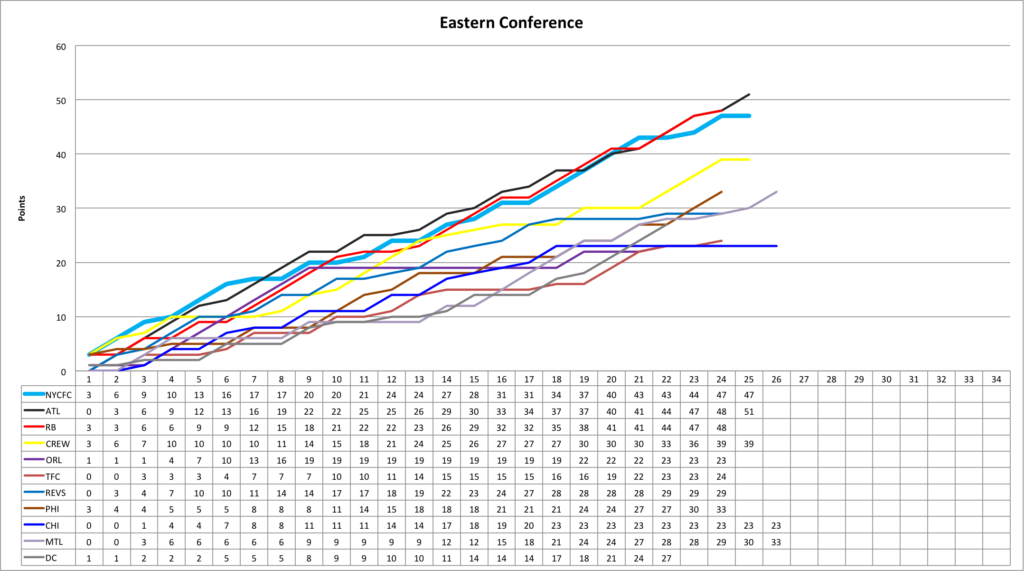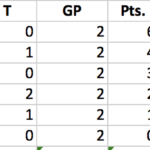
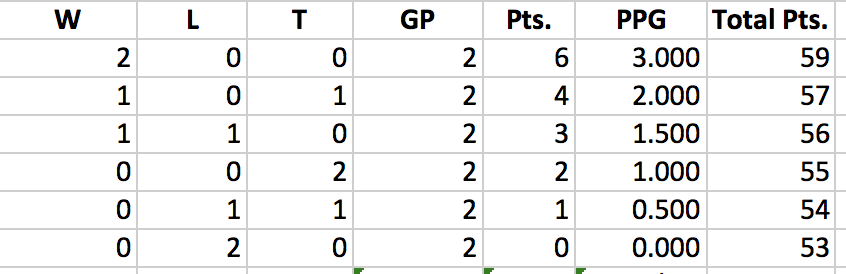
After starting the season 5-0-2, 17 points in 7 games, NYCFC needed to get just 43 points in 27 games, or 1.5926 PPG, to reach the 60 point mark. As late as Game 21, NYC was at 2.048 PPG with a 13-4-4 record and 43 points. They needed just 17 points in 13 games or 1.3077 PPG to get 60 points. After getting only 10 points in 11 games, that is now impossible. The most NYCFC can get is 59 points, if it wins both of its remaining games. Here are all the possibilities.
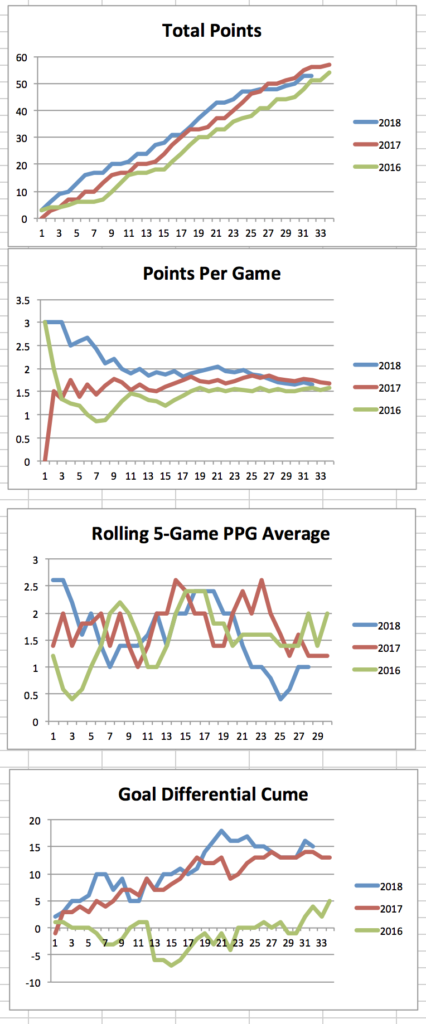
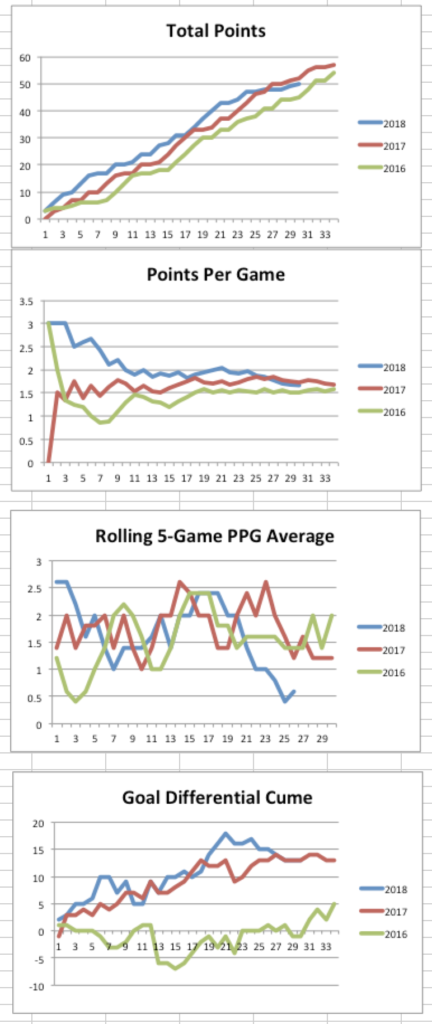
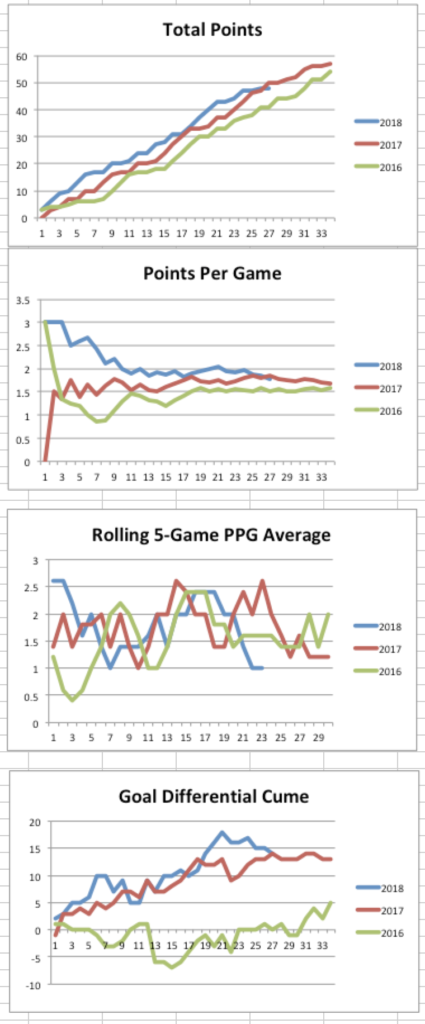
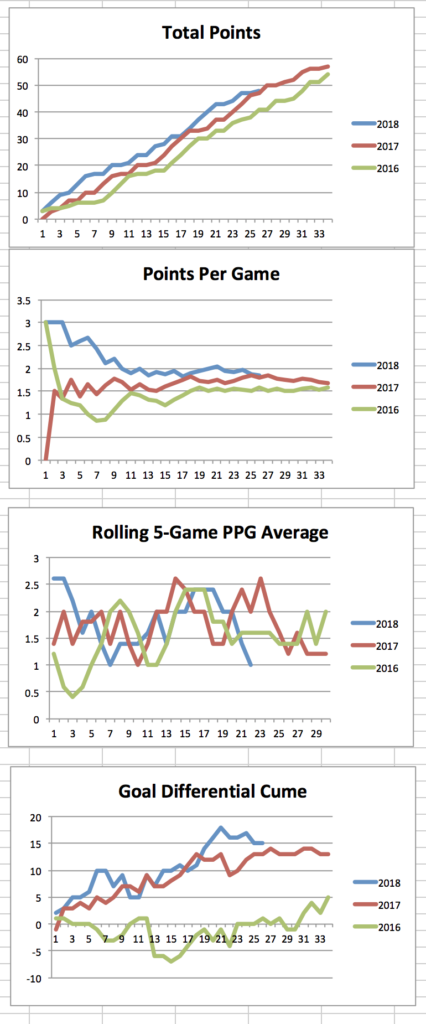
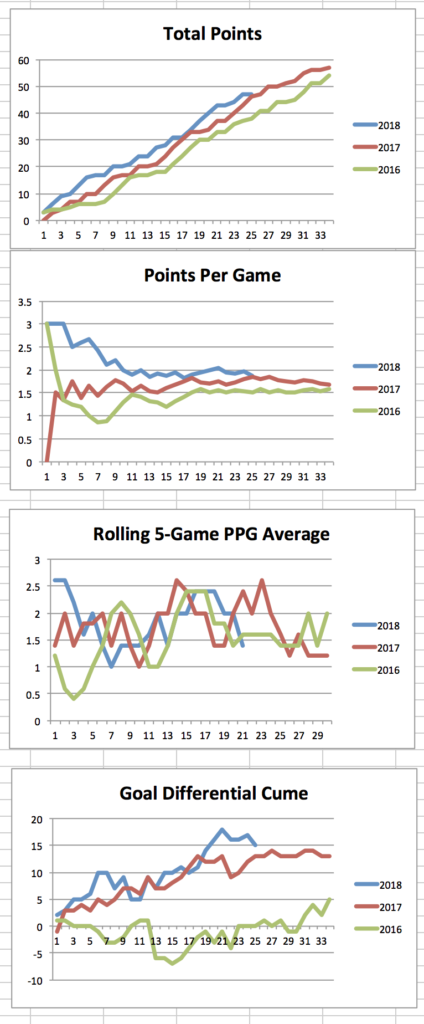
In 2016, NYCFC looked like a team that overcame a slow start to build a record just short of excellent.
In 2017, NYCFC looked like a team that suffered a late season slump caused by an injury to their only reliable scorer and fell just short of excellent.
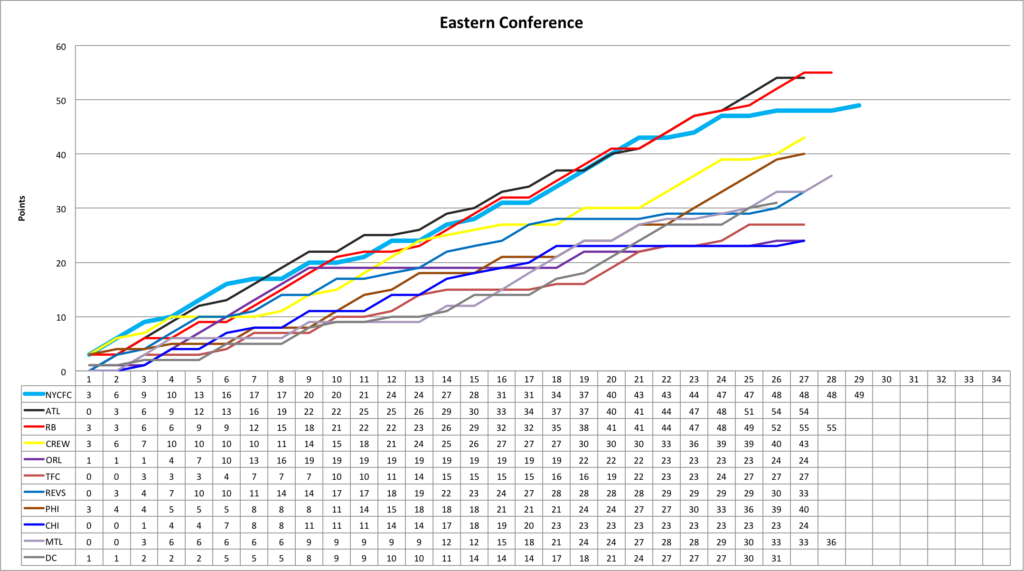
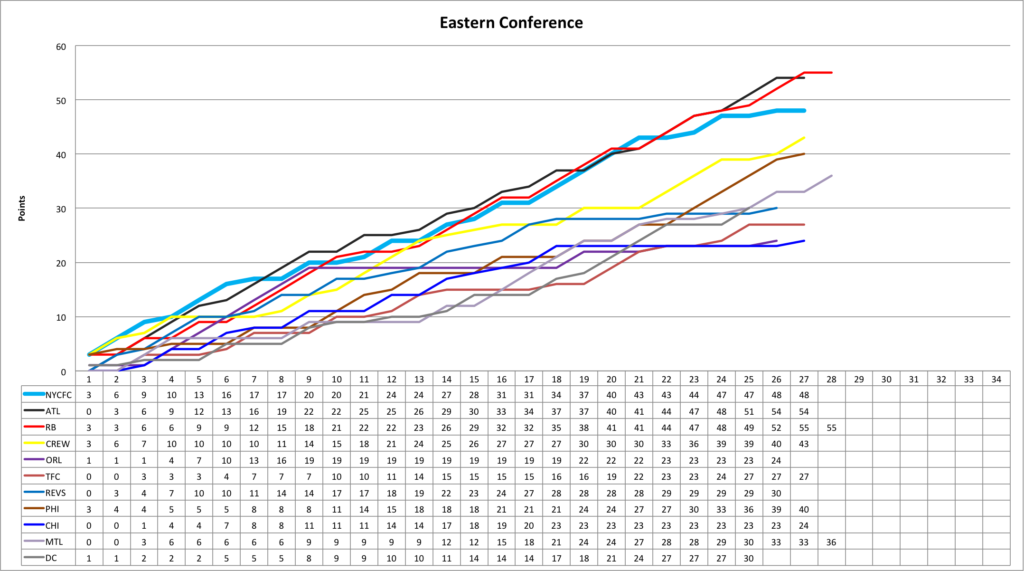
In 2018, NYCFC looks like a team that has been treading water for 3 years.